
Main Points :
- Bitcoin is simultaneously confronting three major resistance levels: the 200-week EMA, the 2021 all-time high near $69,000, and the psychological $70,000 level.
- A confirmed weekly close above the 200-week EMA is considered critical for restoring bullish momentum.
- February marked a potential fifth consecutive monthly decline—something not seen since the 2018 bear market bottom.
- Historical patterns from 2018–2019 suggest that prolonged downside compression can precede explosive multi-month rallies.
- If history rhymes, a structural reversal could begin in April, potentially opening the path toward $80,000 and beyond.
I. Bitcoin Faces a Triple Resistance Wall
Bitcoin (BTC) is currently navigating one of the most technically significant junctures of the current market cycle. After briefly touching $70,040 earlier this week, BTC/USD was rejected and is now consolidating near $67,720. The rejection did not occur in isolation—it happened precisely at a cluster of overlapping resistance levels that collectively form a formidable technical barrier.
At the time of writing, three major resistance points define the battlefield:
- The 200-week Exponential Moving Average (EMA), positioned around $68,330.
- The previous 2021 all-time high near $69,000.
- The psychologically powerful $70,000 round-number level.
These levels are not merely lines on a chart. They represent structural memory in the market. The 200-week EMA historically functions as a dividing line between long-term bull and bear cycles. Meanwhile, the 2021 high represents the last euphoric peak before the macro tightening cycle began. The $70,000 level adds a behavioral layer—round numbers often concentrate liquidity, stop orders, and emotional positioning.
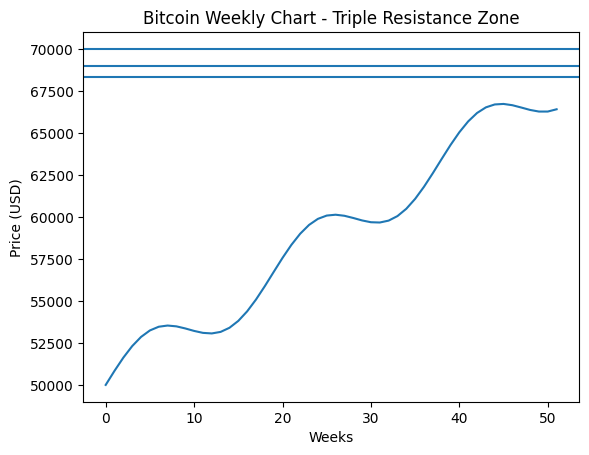
Description: Weekly BTC price chart showing 200-week EMA, $69,000 previous high, and $70,000 psychological resistance.
The convergence of these resistance levels creates what technicians call a “confluence zone.” Breaking one level is meaningful; breaking three simultaneously could redefine market structure entirely.
II. Why the 200-Week EMA Matters So Much
The 200-week EMA has historically served as a macro trend filter. During prior bear markets, Bitcoin has typically traded below this level before reclaiming it decisively during recovery phases. A weekly close above the 200-week EMA would signal not just short-term strength, but long-term structural transition.
Analysts argue that for bullish momentum to sustain, Bitcoin must not only wick above this level but close the week decisively above it. A failure to do so risks reinforcing the narrative that this is merely a relief rally within a broader distribution phase.
Should bulls secure that weekly close, momentum algorithms, systematic funds, and trend-following capital may re-enter the market. In that scenario, $80,000 becomes a technically plausible near-term target.
III. Five Consecutive Monthly Losses: A Rare Bearish Sequence
February recorded approximately a 14% decline, placing Bitcoin on track for five consecutive red monthly candles. Such a streak has not occurred since late 2018, during the final capitulation stage of the previous bear market.
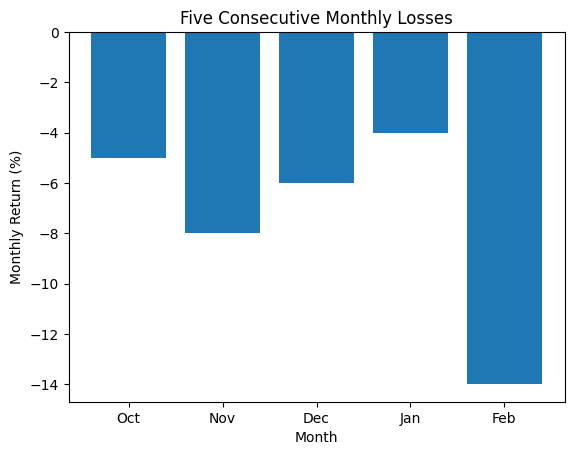
Description: Bar chart of monthly BTC returns highlighting five consecutive negative months.
In 2018, a prolonged compression phase saw Bitcoin drop 57% between August 2018 and January 2019. What followed was a five-month bullish expansion, with BTC rising from $3,329 to $13,880—a 317% surge.
The current structure shows notable parallels:
- Extended downside compression
- Declining volatility
- Persistent but weakening sell pressure
- Macro uncertainty combined with ETF-driven institutional accumulation
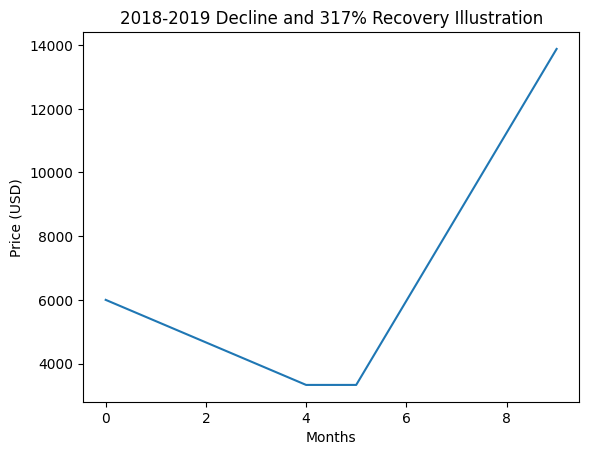
If historical symmetry holds, prolonged drawdowns may be exhausting remaining sellers.
IV. Broader Market Context: ETFs, Liquidity, and Institutional Behavior
While technicals dominate short-term analysis, macro flows are equally important. Recent developments in spot Bitcoin ETFs have introduced structural demand from traditional finance. Institutional capital allocation models often rely on technical confirmation before scaling exposure.
In 2024 and early 2025, ETF inflows have demonstrated the capacity to absorb large quantities of circulating supply. This creates a subtle but powerful shift in market structure: downside liquidity becomes thinner over time as coins migrate into long-term custody vehicles.
At the same time, macro conditions are evolving. With inflation moderating in several major economies and interest rate expectations stabilizing, risk assets—including crypto—are regaining structural support.
For investors searching for new revenue streams, this environment presents two primary opportunities:
- Directional exposure through spot accumulation or leveraged futures strategies.
- Volatility strategies, including options selling during compression phases.
The confluence of technical resistance and macro accumulation creates asymmetric risk-reward conditions.
V. Practical Implications for Blockchain Investors
For readers focused on discovering new crypto assets and practical blockchain applications, Bitcoin’s behavior is more than symbolic—it dictates liquidity conditions across the entire digital asset ecosystem.
Historically, once Bitcoin establishes a sustained breakout above major resistance:
- Capital rotates into large-cap altcoins (ETH, SOL, etc.).
- Risk appetite expands toward mid-cap and emerging sectors.
- Venture funding accelerates into infrastructure, AI-integrated blockchain solutions, and tokenized real-world assets.
If BTC confirms above $70,000 and accelerates toward $80,000, it could signal the beginning of the next expansion phase. That expansion typically benefits:
- Layer-2 ecosystems
- DeFi yield platforms
- Real-world asset tokenization protocols
- Bitcoin-native financial layers (Lightning, Ordinals, staking derivatives)
From a portfolio strategy standpoint, Bitcoin breaking structural resistance often serves as the “green light” for broader crypto beta exposure.
VI. Could April Mark the Reversal?
Historical data suggests that extreme multi-month compression often precedes a volatility expansion phase. If March closes with reclaiming resistance levels, April could initiate structural momentum.
However, risks remain:
- A failure at $70,000 could trigger liquidity sweeps toward $60,000.
- Macro shocks (rate surprises or geopolitical tensions) could disrupt momentum.
- ETF inflows may slow if broader equity markets weaken.
Investors should prepare scenario-based strategies rather than binary positioning.
Conclusion: A Structural Moment for Bitcoin and the Broader Crypto Market
Bitcoin stands at a decisive inflection point. The convergence of the 200-week EMA, the $69,000 prior high, and the $70,000 psychological level forms a macro resistance wall that could determine whether the bear market truly ends.
Five consecutive monthly declines suggest exhaustion—but also potential for explosive reversal, as seen in 2018–2019. Institutional flows, ETF demand, and evolving macro conditions add structural depth to the current setup.
For investors seeking new crypto opportunities and blockchain-based revenue streams, this is not merely a technical event. It is a liquidity event. A confirmed breakout could reignite capital rotation across the digital asset ecosystem.
March may determine the structure. April may determine the momentum. And the next decisive weekly close could shape the next multi-year cycle.