
Main Points:
- Surging Altcoin Inflows: Open interest across major altcoins jumped from $26 billion to $44 billion in July, signalling heightened speculative positioning.
- Ethereum Outperformance: ETH has outpaced Bitcoin over the past two weeks, contributing to a $216 billion gain in total altcoin market cap.
- Key Support & Resistance: On‑chain realised price metrics place strong support around $2,100–$3,000, while the +1σ band of active realised price at $4,500 marks a probable resistance zone.
- Derivatives Market Froth: Elevated leverage in perpetual futures, with ETH dominance at multi‑year highs, may amplify volatility shocks.
- Price Targets & Risks: Short‑term target at $4,500 if momentum holds; longer‑term forecasts (e.g. ETH $10,000 by year‑end) reflect bullish analyst sentiment but carry pronounced downside risk.
1. Surging Altcoin Inflows
In July 2025, Glassnode’s weekly “Froth and Speculation” report highlighted a dramatic increase in open interest (OI) across leading altcoins—Ethereum (ETH), Solana (SOL), XRP, and Dogecoin (DOGE). Open interest rose from approximately $26 billion at the start of the month to $44 billion by July 23, reflecting an influx of leveraged positions in derivative markets. Elevated leverage traditionally amplifies both upside and downside moves, suggesting the market is entering a more reflexive and potentially fragile state.
[Insert Figure 1: Altcoin Open Interest Growth (July 1–23, 2025)]
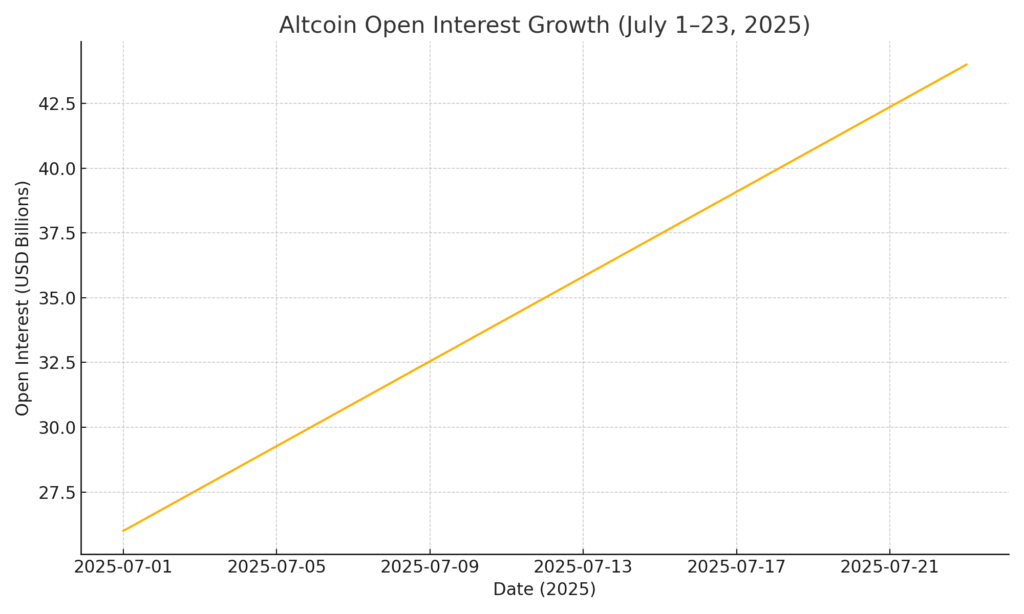
Insertion Point: Figure 1 should appear here, illustrating OI growth from $26 B to $44 B.
2. Ethereum’s Outperformance
Over the past fortnight, Ethereum has outperformed Bitcoin, contributing significantly to a $216 billion increase in total altcoin market capitalization. While Bitcoin’s price has remained relatively flat—trading in a narrow range around $104 000—altcoins have surged, with ETH up over 15% in two weeks. This rotation of capital from BTC into higher‑beta assets marks the emergence of an “altseason” that began around July 9, when Bitcoin dominance dropped from 63.8% to 60.8%.
[Insert Figure 2: Bitcoin Dominance vs. Ethereum Price (June–July 2025)]
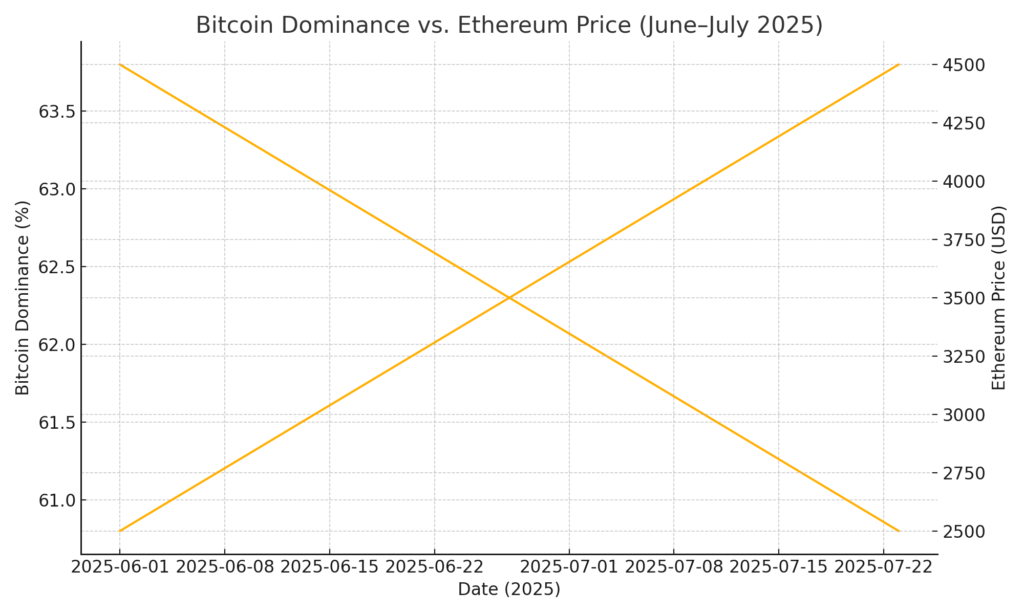
Insertion Point: Figure 2 should compare BTC dominance line chart against ETH USD price.
3. Key Support and Resistance Levels
Glassnode’s on‑chain realised metrics provide a lens into investor behaviour:
- True Market Mean (TMM): $2 500 — the average price paid by economically active investors.
- Active Realised Price (ARP): $3 000 — average entry price for coins moved recently.
- Overall Realised Price: $2 100 — the average cost basis across all ETH in circulation.
The $2 100–$3 000 band aligns with a high-density cluster in the Coin‑By‑Distribution (CBD) metric, indicating strong support and potential congestion on any breakdown. Conversely, the +1σ band above the ARP sits around $4 500, historically marking regions where sell‑side pressure intensifies. A breach of $4 500 would signal significant overheating and could provoke profit‑taking from both retail and whale holders.
4. Froth in the Derivatives Market
The derivatives landscape has mirrored the spot surge. ETH’s share of perpetual futures open interest reached its highest level since the 2022 cycle lows, overtaking BTC for the first time in over two years. Major altcoins collectively saw OI swell by over $180 billion across July, underlining a speculative bubble forming in the derivatives arena. While leverage can magnify gains, it equally exacerbates drawdowns during volatility spikes—raising the spectre of liquidations and cascading price moves if momentum stalls.
5. Price Targets and Risk Scenarios
Short‑Term Target: $4 500
Based on ARP +1σ analysis, $4 500 represents the logical near‑term ceiling, where traders may lock in gains. A sustained break above this level could entrench bullish sentiment, potentially triggering a FOMO‑driven leg toward $5 000.
Bullish Analyst Forecasts
Notable analysts, including Bitwise CIO Matt Hougan and ex‑BitMEX CEO Arthur Hayes, have laid out aggressive year‑end targets—ranging from ETH $7 500 to $10 000 and BTC $250 000. These estimates hinge on continued ETF inflows (SoSoValue reports $907 million net ETH ETF inflow last week) and institutional adoption.
Downside Risks
However, if Bitcoin reasserts dominance or macro headwinds—such as Fed rate hikes or global equities sell‑offs—materialize, altcoins may suffer outsized corrections. A retest of the $3 000 support level would be critical to monitor; a decisive break could see Ethereum revisit its $2 100 realised price floor.
Conclusion
Glassnode’s late‑July report underscores an altcoin renaissance driven by robust inflows and leveraged positioning. Ethereum, as the market’s bellwether altcoin, has demonstrated resilience and momentum, but stands at a key inflection between $3 000 support and $4 500 resistance. Traders eyeing the next leg higher should watch on‑chain realised bands and derivatives leverage metrics closely. While bullish forecasts paint an enticing path to $10 000, the market’s fragile structure demands vigilant risk management. Whether the current rally culminates in a sustained bull run or succumbs to froth‑induced volatility will hinge on a delicate balance of inflows, on‑chain sentiment, and broader macro dynamics.
