Main Points:
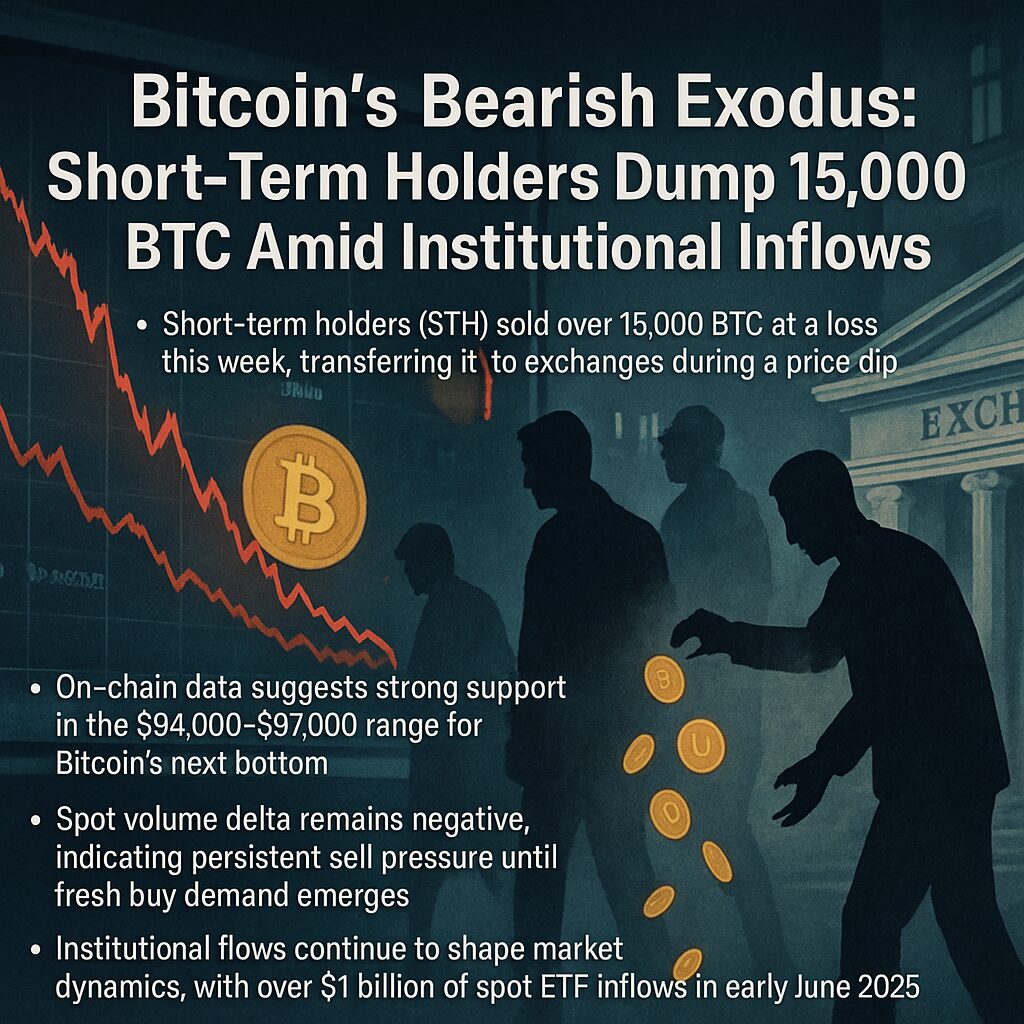
- Short-term holders (STH) sold over 15,000 BTC at a loss this week, transferring it to exchanges during a price dip.
- On-chain data suggests strong support in the $94,000–$97,000 range for Bitcoin’s next bottom.
- Spot volume delta remains negative, indicating persistent sell pressure until fresh buy demand emerges.
- Institutional flows continue to shape market dynamics, with over $1 billion of spot ETF inflows in early June 2025.
Introduction
Bitcoin (BTC) has experienced subdued price action this week, with geopolitical tensions in the Middle East and the upcoming U.S. Federal Open Market Committee (FOMC) meeting prompting investors to adopt a cautious stance. Despite the muted trading environment, on-chain analytics platforms CryptoQuant and Glassnode reveal that short-term holders—sometimes called “bears”—have offloaded more than 15,000 BTC at a loss, reinforcing a familiar pattern of capitulation during downturns. Meanwhile, institutional demand via spot Bitcoin exchange-traded funds (ETFs) has surged, underscoring a tug-of-war between retail selling pressure and professional accumulation.
Short-Term Holder (STH) Squeeze
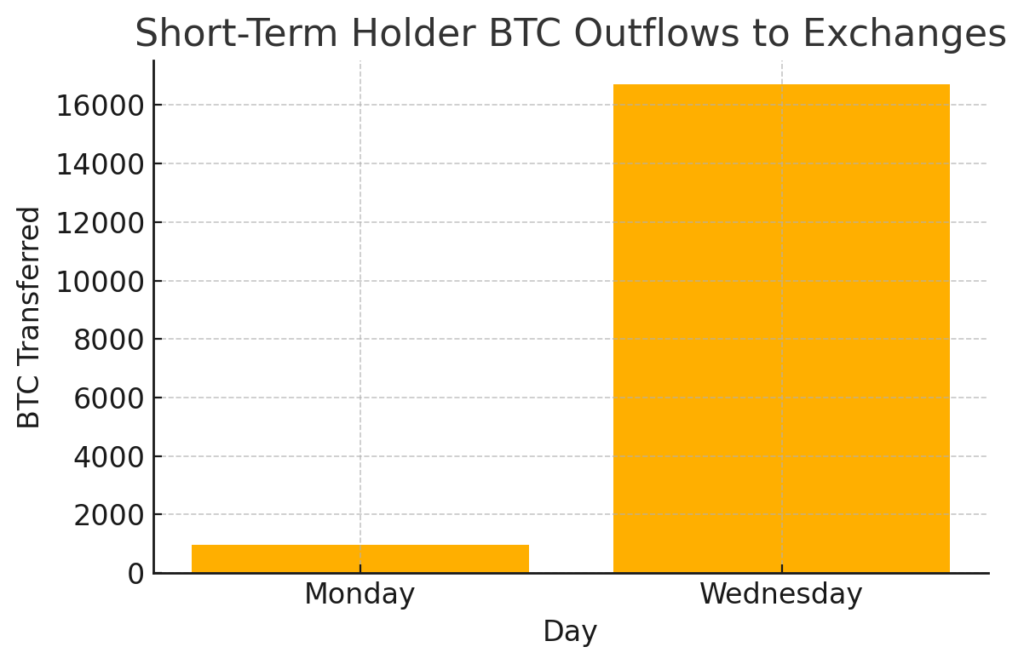
According to Glassnode’s data, Monday saw 959 BTC moved to exchanges at a loss, but by Wednesday STH outflows had skyrocketed to 16,700 BTC—coinciding with a price drop from $106,500 to $103,500. This spike illustrates the classic panic-selling behavior of short-term holders, who often lock in losses when prices dip sharply. <figure> <img src=”attachment://Short-Term Holder BTC Outflows to Exchanges.png” alt=”Bar chart of BTC outflows” style=”width:60%;”/> <figcaption><strong>Figure 1.</strong> Short-term holders’ BTC outflows to exchanges over two days. Data: Glassnode.</figcaption> </figure>
When these weaker hands exit, their coins frequently find buyers among long-term holders (LTH), or “bulls,” who view the dip as an opportunity. Over the past month, much of this STH supply has been soaked up by LTH addresses, helping maintain Bitcoin’s price above $100,000.
On-Chain Support Levels
CryptoQuant’s chain cost analysis indicates that the realized cost basis for short-term holders currently lies between $94,000 and $97,000. Should sellers exhaust their willingness to capitulate below this range, it may serve as a natural price floor. A sustained rebound from this zone could trigger retests of fair value gaps (FVGs) and daily order blocks on the Bitcoin 1-day chart, potentially stabilizing prices just below $100,000.
The “Blind Spot” in Spot Volume Delta
Swissblock’s volume delta metric—measuring the difference between buying and selling pressure on spot exchanges—has remained consistently negative since June 1, 2025. Despite recent rebounds, the lack of meaningful buy-side momentum suggests that the market is still in a selling bias, a so-called “blind spot,” until fresh demand materializes. This dynamic leaves Bitcoin vulnerable to further downside, especially if macro tailwinds (e.g., rate cuts) fail to materialize.
The Institutional Backdrop
While retail participants grapple with losses, institutional interest remains robust. From June 10–14, 2025, spot Bitcoin ETFs saw inflows of $1.07 billion, led by BlackRock’s iShares Bitcoin Trust (IBIT), which now holds over 662,500 BTC—about 3% of total supply. Smaller funds likewise attracted capital, with a combined $389 million flowing in over the past 24 hours.
The Federal Reserve’s decision to hold interest rates steady at 4.25%–4.5% on June 18, 2025, further buoyed prospects for the asset class, as traders anticipate eventual dovish pivots that could benefit risk assets, including Bitcoin trading around $104,364 post-announcement. Meanwhile, major banks like JPMorgan Chase now accept Bitcoin ETF shares as collateral for loans, signaling deepening integration between traditional finance and crypto.
Practical Implications for Investors
For readers scouting new digital assets or revenue opportunities, these developments underscore two key strategies:
- Accumulate in Support Zones
With on-chain cost bases pointing to $94,000–$97,000, traders may place staggered buy orders in this range, capitalizing on potential capitulation lows. - Monitor Institutional Flows
ETF inflows serve as a real-time gauge of professional demand. Surges often precede price appreciation, making fund flow data essential for timing entries.
Conclusion
This week’s significant loss-triggered selling by short-term holders highlights the cyclical nature of Bitcoin markets—weak hands exit during sharp retracements, only to be absorbed by stronger, long-term bulls. On-chain analytics pinpoint a support range of $94,000–$97,000, offering a logical entry zone for opportunistic investors. Yet, persistent negative spot volume delta underscores the need for renewed buy-side momentum. In contrast, institutional inflows via spot ETFs continue unabated, reflecting a long-term conviction in Bitcoin’s role as a strategic asset. For those seeking new crypto assets and practical blockchain applications, blending on-chain cost analysis with real-time fund flow monitoring may prove the most effective approach in navigating the next phase of Bitcoin’s evolution.
