Key Takeaways :
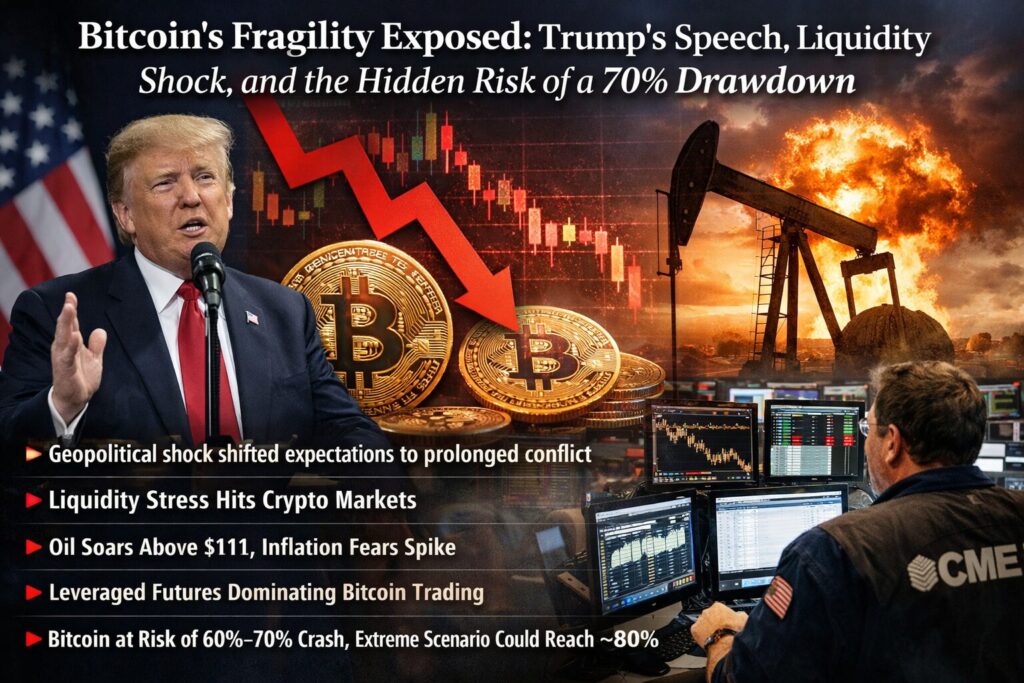
- A geopolitical shock triggered by Donald Trump shifted market expectations from “quick resolution” to prolonged conflict
- Risk assets—including crypto—entered a liquidity stress phase, not just a price correction
- Oil surged above $111 (+11%), strengthening inflation pressure and tightening global liquidity
- Bitcoin’s structure is increasingly driven by leveraged futures (especially on Chicago Mercantile Exchange) rather than spot demand
- A liquidation cascade could drive BTC down –60% to –70% mid-term, with extreme scenarios reaching –80%
1. A Speech That Changed the Market’s Assumptions
The global financial landscape shifted abruptly on April 1, 2026, when Donald Trump delivered a speech signaling a potential escalation of military action against Iran. His remark that “extremely intense attacks will occur within 2–3 weeks” shattered the prevailing market narrative of a near-term resolution to geopolitical tensions.
Until that point, markets had been pricing in a gradual de-escalation. Equity markets, cryptocurrencies, and risk-sensitive assets were supported by the assumption that conflict would remain contained. Trump’s statement reversed that assumption instantly.
The immediate reaction was telling. U.S. equities dropped sharply intraday before partially recovering, with the S&P 500 closing around –0.23% and the Dow Jones Industrial Average at –0.39%. However, Asian markets reacted more violently, with South Korea’s KOSPI plunging –4.2%.
At the same time, oil surged dramatically. WTI crude oil jumped approximately +11% to around $111, while Brent crude rose more than 7%. The U.S. dollar strengthened, and USD/JPY moved toward 159, reflecting capital flight into safer fiat currencies.
This was not merely a geopolitical event—it marked the beginning of a macroeconomic tightening cycle driven by energy inflation and liquidity contraction.
2. From Risk-Off to Liquidity Crisis
What makes this event structurally important is not the price reaction itself, but the underlying shift in market mechanics.
Volatility spiked sharply. The VIX rose to around 25, signaling heightened fear. Meanwhile, bond market stress indicators such as MOVE and commodity volatility indices (OVX, GVZ) approached crisis levels.
Liquidity conditions deteriorated rapidly. A key signal came from U.S. Treasury auctions, where spreads widened by over 27% month-on-month. This reflects declining demand for bonds relative to supply—an early indicator of systemic stress.
The combination of:
- Rising oil prices (inflation pressure)
- Stronger dollar (tightening global liquidity)
- Higher volatility (risk aversion)
creates a feedback loop that drains capital from risk assets—including cryptocurrencies.
This is critical: Bitcoin is often marketed as “digital gold,” but in practice, it behaves more like a high-beta liquidity asset. When liquidity tightens, it suffers disproportionately.
3. The Hidden Weakness: Bitcoin’s Leveraged Structure
The most alarming signal comes from the structure of Bitcoin derivatives markets, particularly on the Chicago Mercantile Exchange.
Open interest (OI) in Bitcoin futures has reached approximately 180,000–200,000 BTC, near historical highs. More importantly, positions are heavily concentrated in short-term maturities (1–3 months).
This reveals a fundamental shift:
Bitcoin’s price is no longer primarily driven by spot demand, but by leveraged positions.
This has profound implications.
When markets are stable, leverage amplifies gains. However, during shocks, it becomes a destabilizing force. In a short-term maturity structure, traders are less likely to roll positions forward and more likely to liquidate them under stress.
This creates a cascading mechanism:
- Price declines
- Forced liquidations (margin calls)
- Further price declines
- Additional liquidations
This feedback loop can accelerate rapidly, especially under macro stress conditions like the current environment.
4. Scenario Analysis: How Far Can Bitcoin Fall?
Based on current market structure, several scenarios emerge:
Mild Scenario
Bitcoin experiences a controlled correction of around –15%, stabilizing near $600,000 (from ~$700,000 levels).
Severe Scenario
Liquidation cascades intensify due to leverage concentration. BTC declines to around $500,000 (–25% to –30%).
Mid-Term Structural Adjustment
If ETF inflows reverse and spot demand weakens, supply-demand imbalance worsens. Bitcoin could fall into the $300,000–$200,000 range (–60% to –70%).
Extreme Scenario (Systemic Crisis)
If geopolitical escalation leads to a prolonged closure of the Strait of Hormuz or full-scale war:
- Global equities drop more than –30%
- Oil surges to $150–$200
- Liquidity collapses globally
In this stress case, Bitcoin could fall toward $100,000 (–80%+).
Bitcoin Liquidation Cascade Model
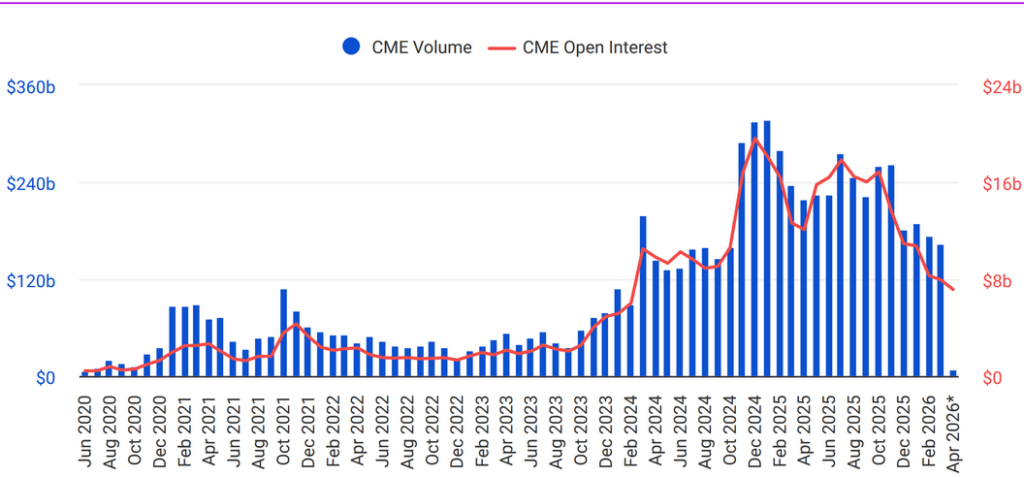
5. CME Open Interest: A Critical Indicator
The concept of open interest is central to understanding this risk.
Open interest measures the total number of outstanding futures contracts that have not been settled. When both price and OI increase, it indicates fresh capital entering the market—typically a bullish signal.
However, when:
- Prices stagnate or fall
- OI continues to rise
it suggests excessive leverage buildup.
In the case of CME Bitcoin futures, this pattern implies that institutional capital is increasingly exposed through leveraged instruments rather than spot holdings.
Furthermore, concentration in short-term maturities increases sensitivity to external shocks. Contracts nearing expiration are more vulnerable to forced liquidation rather than orderly rollover.
Thus, OI is not merely a participation metric—it is a proxy for systemic fragility.
CME Bitcoin Futures Open Interest Structure

6. Bitcoin Is Not a Safe Haven
A key misconception exposed by this event is the idea that Bitcoin functions as a safe-haven asset.
Unlike gold, Bitcoin does not benefit from risk-off environments in a consistent manner. Instead, it behaves as a liquidity-sensitive asset:
- When liquidity expands → Bitcoin rises sharply
- When liquidity contracts → Bitcoin falls sharply
This aligns more closely with high-growth tech stocks than with traditional hedges.
The current environment—characterized by inflation resurgence, dollar strength, and tightening financial conditions—is inherently unfavorable for such assets.
7. What Determines the Recovery?
Even if Bitcoin experiences short-term rebounds, the sustainability of any recovery depends on two key factors:
1. ETF Flows
Institutional demand through spot ETFs has been a major driver of Bitcoin’s recent rally. A reversal in these flows would remove a key support mechanism.
2. Real Demand (On-Chain Activity)
Sustainable growth requires genuine usage—transactions, settlements, and utility—not just speculative positioning.
Without these, rallies are likely to be temporary and driven by short covering rather than structural strength.
Conclusion: From Direction to Durability
The market is no longer asking whether Bitcoin will go up or down in the short term. Instead, the critical question has shifted to:
Can the market structure withstand external shocks?
Trump’s speech did not create this fragility—it revealed it.
Bitcoin today is deeply intertwined with global liquidity conditions and leveraged financial structures. As such, it is highly sensitive to macroeconomic tightening and geopolitical instability.
For investors and builders alike—especially those seeking new crypto opportunities or practical blockchain applications—the lesson is clear:
- Price alone is not the signal
- Structure is the signal
Understanding leverage, liquidity, and institutional positioning is now essential.
The next phase of the crypto market will not be defined by momentum—but by resilience.