
Key Points:
- Signs of weekend sell-off winding down, with consolidation between $104,000 and $109,000.
- Range-bound between roughly ¥14.4 M ($99,600) and ¥16.1 M ($111,400) from early June to early July.
- Recent rebound off support hints at bullish momentum; watch for a clear close above resistance.
- Market psychology is divided between bulls eager for a breakout and cautious traders wary of another pullback.
- Macro correlations with U.S. equities remain high, framing Bitcoin as a risk asset in July 2025.
1. Bitcoin’s Turbulent Weeks: Range Market and Signs of Rebound
After a period of sharp moves in late May, Bitcoin has spent the past few weeks trapped in a clear range, oscillating between major support and resistance levels. Although weekend sessions often see profit-taking—characterized by a dip in prices on Saturdays and Sundays—this pattern appears to be losing steam. Traders are noting that Monday’s early dips have been shallow, suggesting sellers may be exhausted.
Indeed, Wall Street’s influence has recast Bitcoin as a macro-driven risk asset rather than a hedge, with its correlation to U.S. equities near the higher end of historical ranges (0.48) and almost zero correlation to gold or the dollar. This context is crucial: Bitcoin’s price swings are increasingly tied to broader market sentiment, making its range-bound behavior a reflection of both crypto-specific dynamics and macro trends.
2. End of Weekend Sell-Off?! Consolidation and Weekly Dynamics
This weekend saw Bitcoin dip modestly but recover swiftly. After trading near $104,000 on Saturday, prices climbed back above $106,000 by Sunday night, indicating that sellers may be fatigued. Historical data show that Bitcoin often experiences brief weekend sell-offs only to be bought back in Asia and Europe on Monday mornings
Such patterns can be deceptive—false breaks below support are common. Yet the narrowing of intraday swings suggests consolidation is underway, not a resumption of a downtrend. If this holds, the coming days will be pivotal to see whether buyers can sustain bids above $108,000–$109,000.
3. Range Formation and Key Levels: Early June to Early July Price Movements
From June 1 through July 6, Bitcoin’s price carved out a clear trading range:
- Resistance: ¥16,100,000 ($111,390 at 1 USD = 144.65 JPY)
- Support: ¥14,400,000 ($99,576 at 1 USD = 144.65 JPY)
Within this band, prices repeatedly rebounded off support and stalled at resistance, evidencing balanced buying and selling pressure. Major JPY highs of ¥16.1 M (mid-June) and lows of ¥14.4 M (late June) defined the corridor traders eyed closely.
4. Recent Price Trends and Focus Ahead: Rebound and Uptrend Expectations
Recent data points highlight Bitcoin’s bounce:
- June 8: $106,000 marked a weekend low before recovery
- June 20: Prices held above $104,000 amid sideways trade
- July 1: Profit-taking after a record June close saw prices dip to $106,175
- July 6: Bitcoin rallied to $109,000 as buyers re-entered
These points are plotted below for clarity:
See the chart below for Bitcoin’s price trajectory from June 8 to July 6, 2025.
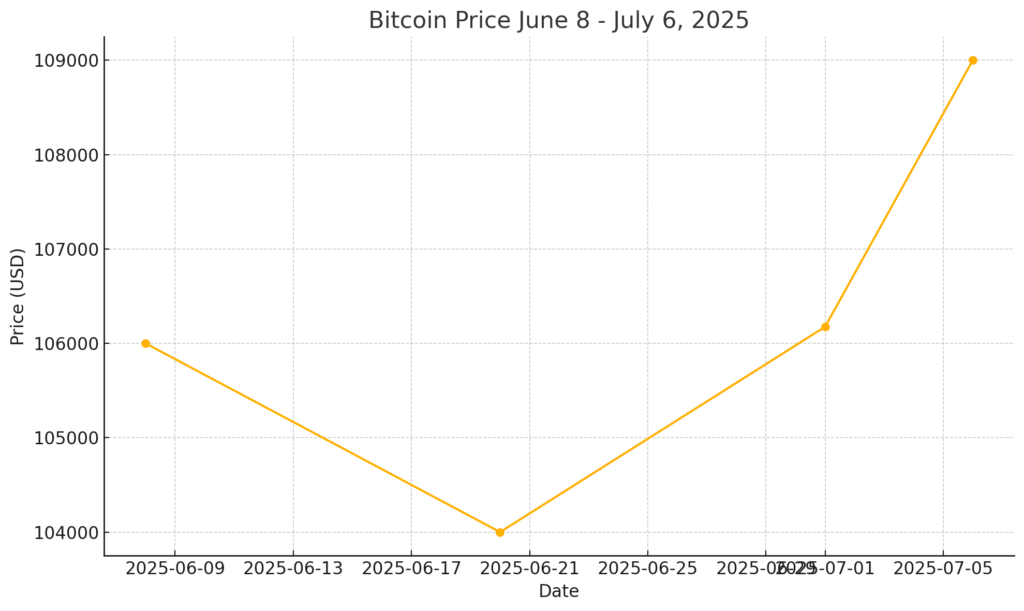
(Chart displayed above)
The rebound off June’s lows shows bulls still active near support. That said, sustaining buys above $108,000–$109,000 is essential for signaling a shift toward a sustained uptrend.
5. Challenge of Breaking Resistance and Market Sentiment: Scenarios Ahead
As Bitcoin approaches the ¥16.1 M ($111,390) resistance, market psychology splits:
- Bullish Breakout: Strong buying pressure could clear resistance, flipping it to support and paving the way toward new yearly highs near $115,000–$120,000. This scenario would likely draw fresh inflows from institutional players eyeing risk assets.
- False Break and Retreat: Given the history of failed attempts, sellers might re-emerge at resistance, dragging prices back toward support. A decisive drop below ¥14.4 M ($99,600) would renew bearish sentiment and deepen range trading.
Traders should watch volume on any move above $111,000; a high-volume break could confirm a genuine shift in trend, while low-volume attempts may signal a trap.
Conclusion
Bitcoin’s weekend sell-off appears to have lost momentum, giving way to a tighter range between roughly $99,600 and $111,390. Recent rebounds off support suggest bullish potential, but the critical test lies at resistance. A sustained close above ¥16.1 M ($111,390) could herald a fresh uptrend, while failure may extend the range-bound phase. Coupled with high correlation to U.S. equities, Bitcoin’s next moves will be shaped by both crypto-specific catalysts and macro drivers. Traders and investors alike should monitor key levels and confirm breakouts with volume to navigate the coming week successfully.
