
Main Points:
- Bitcoin (BTC) slipped below the inverted head-and-shoulders neckline but found support at the 50-day moving average (around $112,262).
- Ether (ETH) is consolidating between $3,300 and $3,422 and faces resistance at the 20-day MA near $3,652.
- XRP rebounded from the 50-day MA ($2.66) and may test the 20-day MA ($3.19) next.
- Solana (SOL) is trading between its 20-day ($179) and 50-day ($161) MAs, with no clear directional bias.
1. Bitcoin Price Forecast
Subheading: Support at 50-Day MA and Potential Resistance
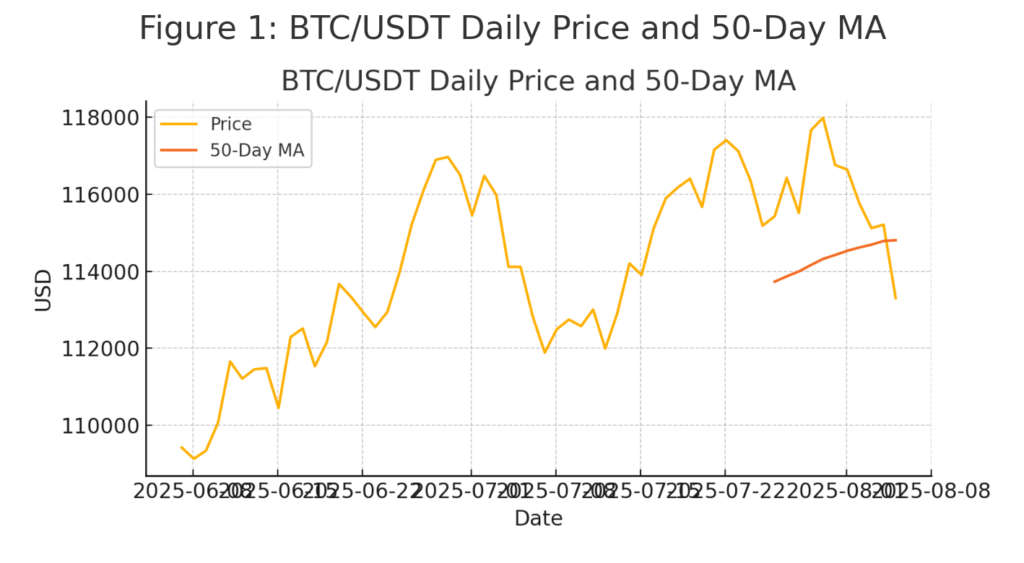
BTC recently broke below the neckline of an inverted head-and-shoulders pattern but halted its decline at the 50-day moving average, currently near $112,262. The 20-day MA has turned downward at about $117,237, and the Relative Strength Index (RSI) sits just below neutral, signaling renewed bearish momentum. Any bounce is likely to face selling pressure between the neckline and the 20-day MA.
If BTC fails below the critical support at $110,530, deeper pullbacks toward $105,000 and possibly $100,000 could materialize. Conversely, a sustained move above the 20-day MA could set the stage for a challenge of the $120,000–$123,218 resistance zone.
[Insert Figure 1: BTC/USDT Daily Chart with 50-Day MA]
2. Ether Price Forecast
Subheading: Fib Retracement Support and Near-Term Upside
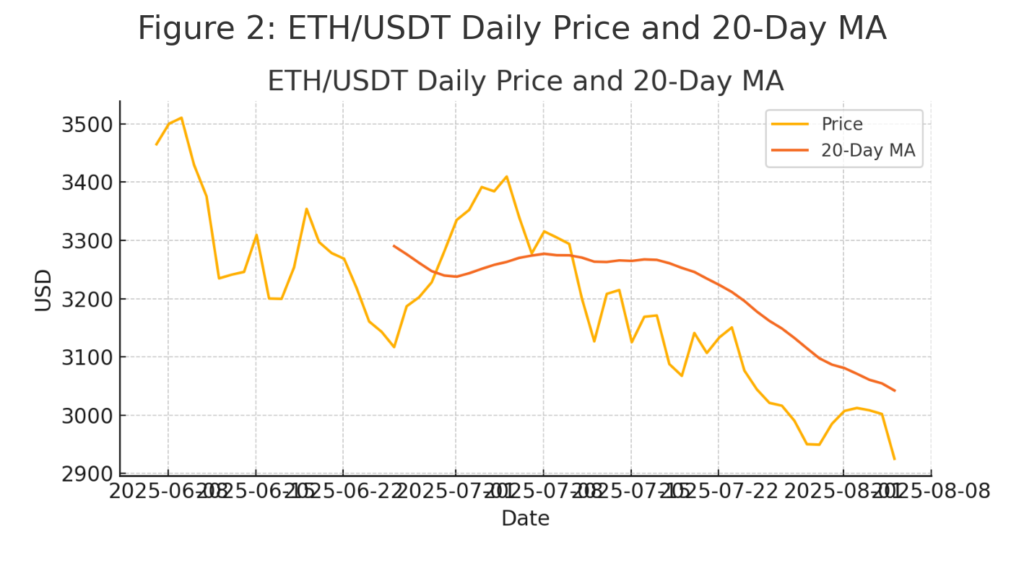
ETH is finding a floor between $3,422 (50% Fibonacci retracement) and $3,300 (61.8% retracement). A rebound will likely confront resistance at the 20-day MA around $3,652. Breaking this level could propel ETH toward $3,941 and even $4,094, where strong selling is anticipated.
On the downside, failure to hold above $3,354 and a drop below the 20-day MA would signal waning bullish interest, increasing the risk of a slide to the 50-day MA at about $3,013.
[Insert Figure 2: ETH/USDT Daily Chart with 20-Day MA]
3. XRP Price Forecast
Subheading: Testing the 20-Day MA After 50-Day Bounce
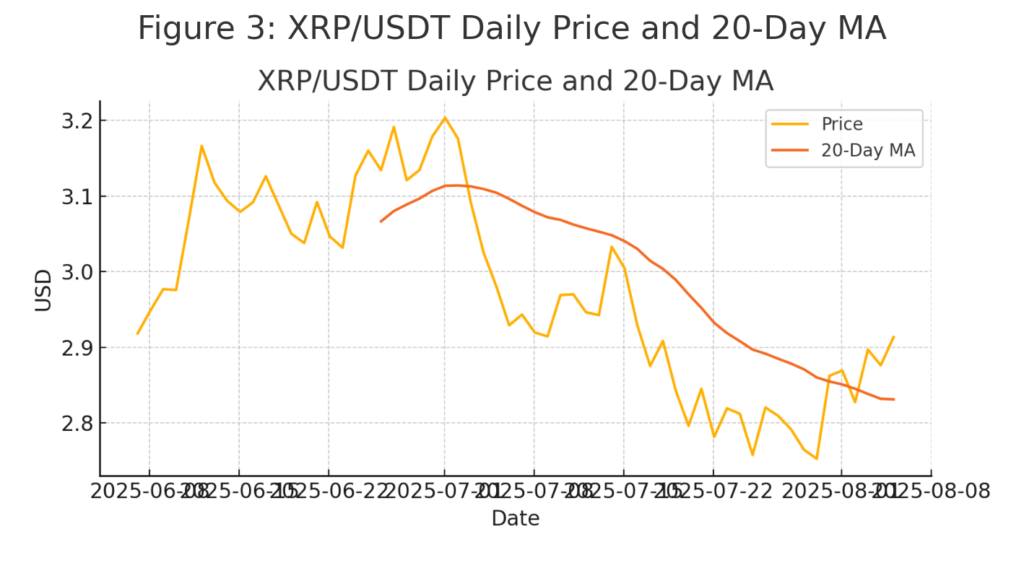
XRP dipped below $2.95 but quickly rebounded off the 50-day MA at $2.66, indicating buying interest at lower levels. The next upside barrier is the 20-day MA near $3.19, where bears may reassert control.
A decisive breakout above the 20-day MA could open room to $3.33 and then $3.66. However, slipping below the 50-day MA could trigger a deeper correction toward $2.40.
[Insert Figure 3: XRP/USDT Daily Chart with 20-Day MA]
4. Solana Price Forecast
Subheading: Range-Bound Between Key Moving Averages
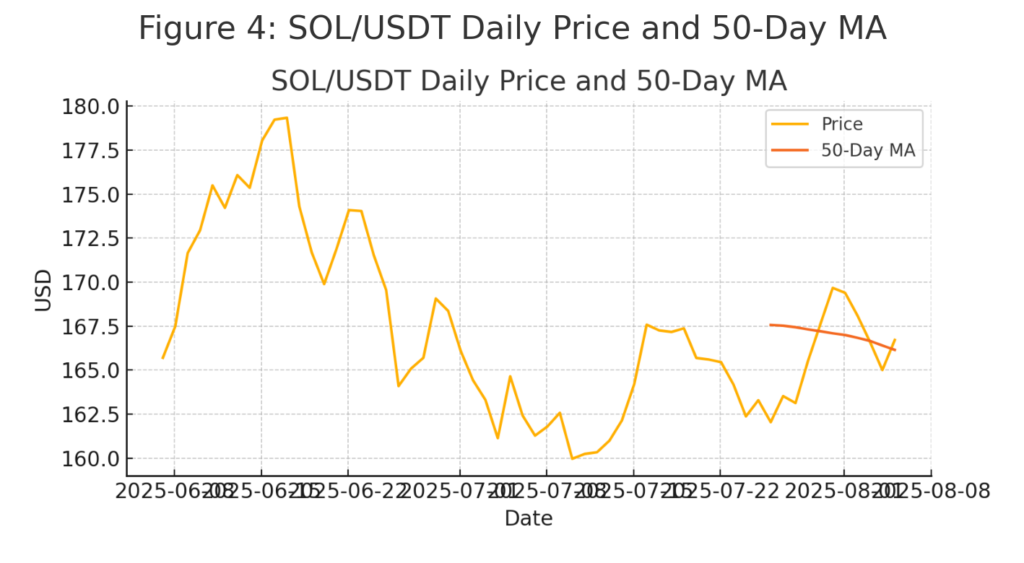
SOL recently broke below its 50-day MA ($161) but recovered, leaving both the 20-day ($179) and 50-day MAs nearly flat and the RSI in bearish territory. This suggests a period of consolidation between the two averages.
A close above the 20-day MA could tilt momentum in favor of bulls aiming for $195, while a drop below $155 would favor bears and could see SOL retest $144 and $137.
[Insert Figure 4: SOL/USDT Daily Chart with 50-Day MA]
Recent Trends and Context
In addition to the technicals above, recent on-chain data shows Bitcoin whale accumulation rising, hinting at long-term bullish conviction. Ether’s DeFi usage continues to grow, with total value locked (TVL) surpassing $50 billion, supporting network demand. XRP awaits regulatory clarity in the U.S., which could serve as a major catalyst. Solana’s ecosystem expansion—driven by NFT projects and gaming—may underpin its medium-term outlook despite short-term technical consolidation.
Conclusion
While each major crypto asset faces near-term technical hurdles—BTC and ETH at their 20-day MAs, XRP at its 20-day, and SOL between its MAs—the broader market context remains cautiously optimistic. Whale behavior, DeFi growth, and ecosystem developments suggest that a clean breakout above key resistances could ignite the next leg of the rally. Traders should monitor the levels highlighted above for signs of either bullish reclaim or bearish rejection.
