Key Takeaways :
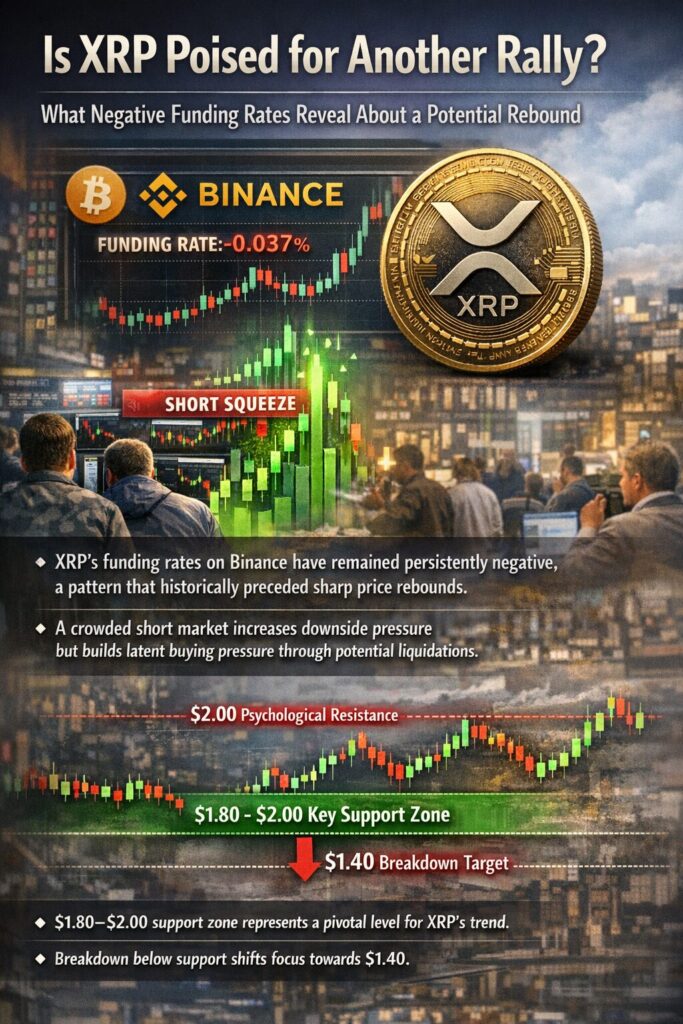
- XRP’s funding rates on Binance have remained persistently negative, a pattern that historically preceded sharp price rebounds.
- A crowded short market increases downside pressure in the short term but simultaneously builds latent buying pressure through potential liquidations.
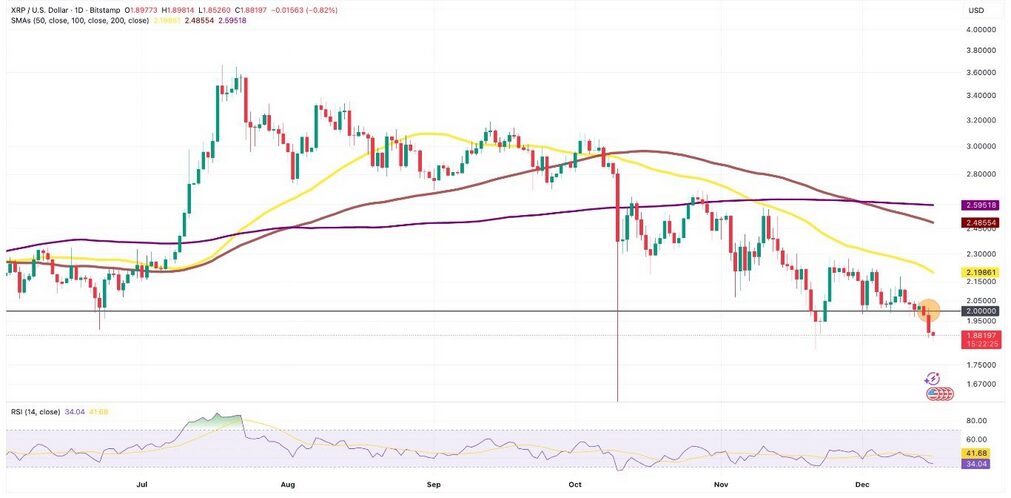
- The $1.80–$2.00 support zone represents a structural pivot for XRP’s medium-term trend.
- On-chain realized loss data suggests that $2.00 remains a psychologically and financially painful level for many holders.
- A confirmed breakdown below support would invalidate the bullish rebound thesis and shift focus toward $1.40.
1. Funding Rates as a Market Psychology Indicator
In derivative markets, funding rates serve as a real-time gauge of trader positioning and sentiment. When funding rates turn negative, it means that short sellers are paying longs to maintain their positions—an indication that bearish bets dominate leveraged trading.
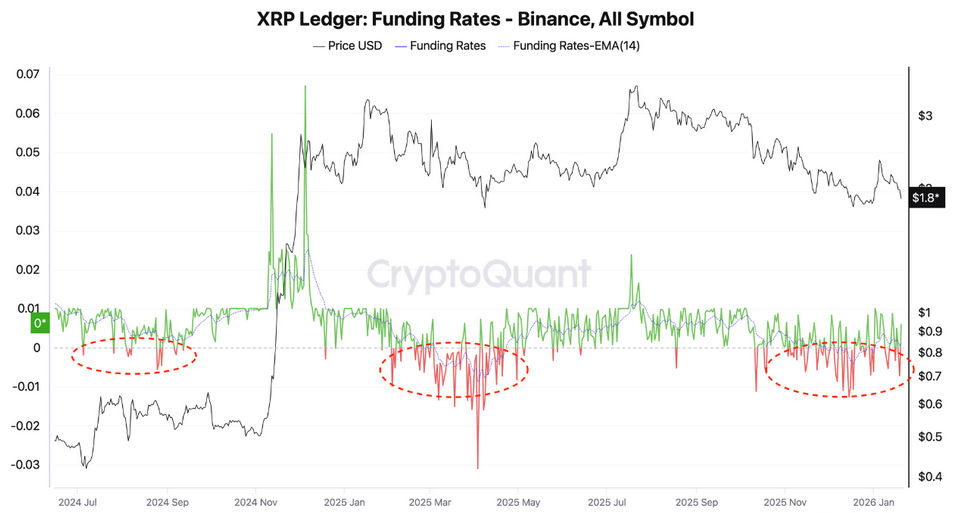
On Binance, XRP’s funding rate has remained largely negative for the past two months. This mirrors several historical periods since 2024 that ultimately resolved in violent upside moves, despite an initially bearish consensus.
Negative funding does not guarantee immediate price appreciation. Instead, it reflects a structural imbalance: too many traders leaning in one direction. Markets tend to punish such consensus when momentum shifts.
“XRP Funding Rate on Binance (2024–2026)”
2. How Negative Funding Rates Can Trigger Short Squeezes
According to on-chain analyst Darkfrost, extended periods of negative funding rates often precede short squeezes—rapid price increases driven by forced liquidations of leveraged short positions.
This dynamic played out multiple times in recent years:
- In mid-2025, similar funding conditions preceded a 50% rally in Bitcoin, dragging major altcoins higher.
- Earlier in the cycle, XRP itself recorded over 100% gains following prolonged bearish positioning.
The mechanism is straightforward:
- Shorts accumulate as price drifts lower.
- Funding payments erode short-side profitability.
- A modest upward price move triggers liquidations.
- Forced buybacks accelerate upside momentum.
As Darkfrost explains, short positions represent future buy orders waiting to happen—but only once price turns against them.
3. Price Context: From $3.66 Highs to a 50% Drawdown
XRP’s current funding dynamics emerged after a sharp correction from its multi-year high of $3.66, recorded in July 2025. Since then, the spot price has fallen by roughly 50%, resetting leverage and flushing out late-cycle optimism.
From a market-structure perspective, this correction created:
- Lower realized leverage
- Reduced open interest
- Concentrated bearish conviction among remaining traders
Such conditions often mark the transition from distribution to accumulation, though confirmation depends on price holding key technical levels.
4. The $1.80–$2.00 Zone: Structural and Psychological Support
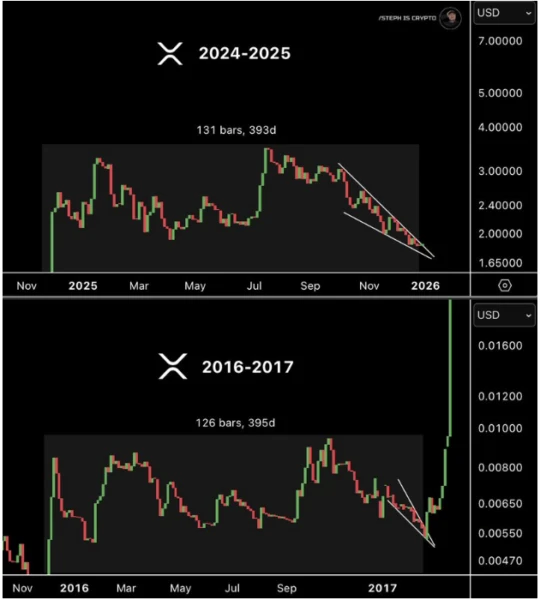
Since January, XRP has been gradually rebounding after testing the lower boundary of a year-long horizontal trading channel. Crucially, this boundary aligns with the $1.80–$2.00 support zone.
This zone is significant for several reasons:
- It served as the launchpad for XRP’s explosive rally to $3.66 in April 2025.
- It overlaps with long-term trendline support.
- It represents a psychologically round number that attracts both buyers and sellers.
“XRP/USD 3-Day Chart with Key Support Zone”
5. Realized Losses: Why $2.00 Still Hurts
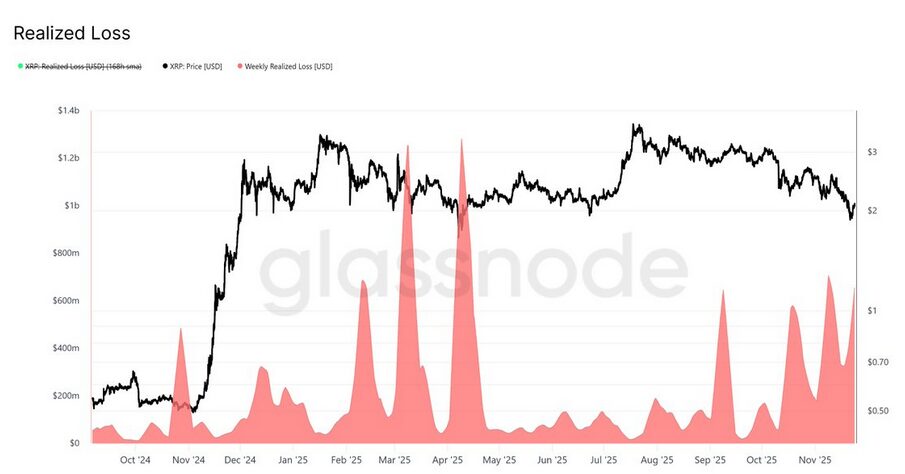
Data from Glassnode reveals that each attempt to reclaim the $2.00 level since early 2025 resulted in $500 million to $1.2 billion in weekly realized losses.
This indicates that many holders who accumulated XRP at higher prices chose to exit at a loss rather than add exposure. As a result:
- Selling pressure intensifies near $2.00.
- Market participants remain emotionally anchored to past drawdowns.
- Breakouts above $2.00 require sustained conviction, not just momentum spikes.
“XRP Price vs. Realized Profit/Loss”
6. Moving Averages and the Bearish Alternative Scenario
From a technical standpoint, XRP faces a critical test at the 50-week exponential moving average (EMA) near $2.22. Failure to reclaim this level as support would strengthen the bearish case.
In that scenario, downside targets include:
- The 200-week EMA around $1.40
- A broader reassessment of XRP’s long-term valuation range
“XRP/USD Weekly Chart with 50- and 200-Week EMAs”
A decisive breakdown below $1.80 would invalidate the “latent buying pressure” thesis entirely, as structural support—and with it, forced short covering—would disappear.
7. What This Means for Investors and Builders
For investors seeking asymmetric opportunities, XRP currently sits at a decision point:
- Upside potential fueled by crowded shorts and negative funding
- Downside risk if macro sentiment or technical support fails
For builders and institutions, the analysis underscores a broader lesson: derivative positioning often moves before spot conviction. Funding rates, realized losses, and liquidation risk offer valuable signals beyond headline price action.
Conclusion: A Market on the Edge of Resolution
XRP’s negative funding rates do not guarantee an imminent rally—but they clearly indicate a market primed for volatility. History shows that when bearish consensus becomes overcrowded, even modest catalysts can trigger disproportionate price responses.
Whether XRP reclaims $2.00 and beyond—or slides toward $1.40—will depend on how the coming weeks resolve this tension between structural support and lingering fear.
For now, XRP stands not as a confirmed breakout candidate, but as a live case study in how sentiment, leverage, and psychology interact in modern crypto markets.
