Key Points :
- Ethereum (ETH) significantly outperformed Bitcoin (BTC) in March 2026, signaling a capital rotation within crypto markets
- Rising market cap and higher volatility position ETH as a risk-on asset capturing upside flows
- Structural supply contraction and exchange outflows are tightening ETH’s supply dynamics
- On-chain metrics show early-stage institutional demand recovery and strong organic network usage
- Ethereum’s expanding ecosystem (DeFi, stablecoins, RWAs) reinforces its role as a financial infrastructure layer
- However, declining trading volume suggests liquidity-driven rally risks in the short term
1. A Defining Month: Capital Rotation from Bitcoin to Ethereum
March 2026 marked a pivotal shift in the cryptocurrency market, where Ethereum emerged as a clear outperformer against Bitcoin. While Bitcoin recorded a modest gain of approximately +1.83%, Ethereum surged by +7.12%, indicating not just a divergence in price but a deeper structural change in capital allocation.
This divergence is particularly important because Bitcoin has long been considered the benchmark asset of the crypto market—a store of value akin to digital gold. Ethereum’s ability to outperform Bitcoin in a relatively stable macro environment suggests that investors are actively reallocating capital toward higher-yield opportunities within the digital asset ecosystem.
Market capitalization trends reinforce this narrative. Bitcoin experienced a slight contraction of approximately -0.43%, whereas Ethereum expanded by +2.97%. This indicates that capital is not merely rotating within speculative altcoins but is consolidating into Ethereum as a primary growth asset.
From an institutional perspective, this kind of rotation typically occurs when investors move from defensive positioning (Bitcoin) to growth-oriented assets (Ethereum), anticipating improved liquidity conditions or increased risk appetite.
ETH vs BTC Monthly Performance Comparison (March 2026)
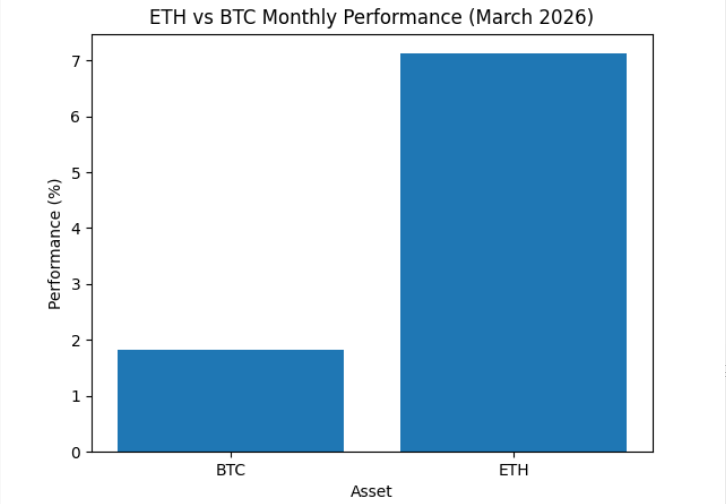
(Bar chart showing BTC +1.83% vs ETH +7.12%)
2. Volatility as Opportunity: ETH as Leveraged Market Beta
Ethereum’s realized volatility stood at approximately 62.8%, significantly higher than Bitcoin’s 49.8%. While higher volatility is often associated with increased risk, in crypto markets it also represents greater return potential.
Ethereum is increasingly behaving like a “leveraged beta” to the crypto market. With a high correlation to Bitcoin (around 0.94), ETH does not move independently but amplifies broader market trends. When the market rises, Ethereum tends to rise faster; when it falls, it may decline more sharply.
This characteristic makes Ethereum particularly attractive for:
- Active traders seeking alpha
- Funds adjusting risk exposure dynamically
- Investors positioning for macro-driven liquidity expansions
In essence, Ethereum sits at the intersection of risk and innovation, capturing flows when capital seeks growth rather than preservation.
3. Supply Dynamics: The Silent Catalyst Behind ETH’s Strength
One of the most critical drivers of Ethereum’s recent outperformance lies in its supply structure.
Ethereum continues to experience net outflows from centralized exchanges, indicating that investors are moving assets into:
- Long-term storage (cold wallets)
- Staking contracts
- DeFi protocols
This behavior reduces immediately available supply in the market, creating a supply squeeze effect when demand increases.
Unlike Bitcoin, which has a relatively predictable supply issuance model, Ethereum’s supply is influenced by:
- EIP-1559 fee burning (reducing circulating supply)
- Staking lockups (removing liquid supply)
- Reduced sell pressure from long-term holders
This combination creates a structurally bullish setup where demand shocks can lead to disproportionate price movements.
ETH Exchange Outflows and Supply Reduction Trend
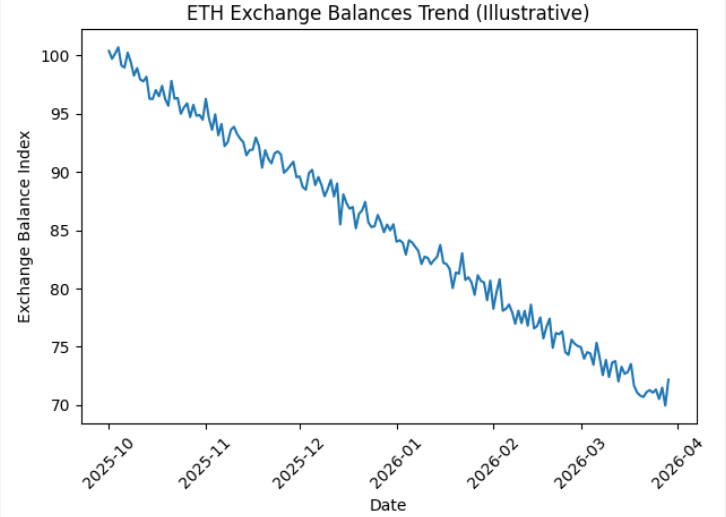
(Line chart showing declining exchange balances over time)
4. On-Chain Signals: Early Institutional Recovery, Strong Retail Usage
On-chain metrics provide deeper insight into Ethereum’s underlying strength.
Coinbase Premium Gap
The Coinbase Premium Gap—a measure of price differences between Coinbase and other exchanges—remains slightly negative but is trending upward. This suggests:
- Selling pressure is decreasing
- U.S.-based institutional demand is beginning to recover
Historically, this pattern has been observed during the early stages of bullish cycles, where institutional participation lags behind initial retail-driven momentum.
Active Addresses
Ethereum’s number of active addresses continues to rise steadily, indicating:
- Increased network usage
- Expanding economic activity
- Strong organic demand independent of speculation
When active addresses increase alongside price, it typically signals sustainable growth rather than speculative bubbles.
Active Addresses Growth vs Price Trend
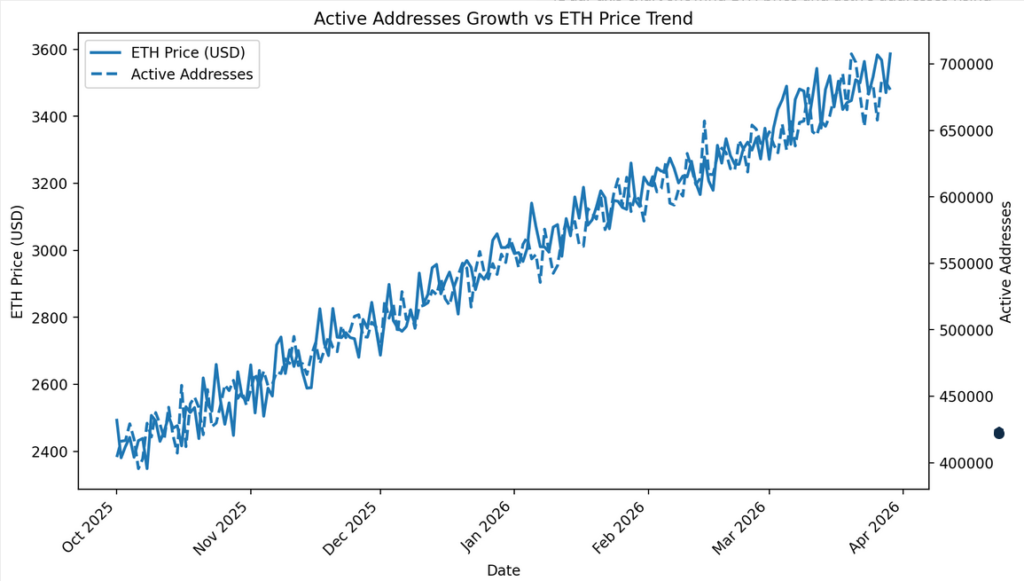
(Dual-axis chart showing ETH price and active addresses rising together)
5. Ethereum as Financial Infrastructure: Beyond a Simple Asset
Ethereum’s advantage over Bitcoin extends beyond price dynamics—it lies in its role as a programmable financial platform.
Key sectors built on Ethereum include:
- Stablecoins (e.g., USDC, USDT dominance on Ethereum)
- DeFi protocols (lending, AMMs, derivatives)
- Tokenized Real-World Assets (RWA)
These sectors generate continuous on-chain activity and capital flows, transforming Ethereum into a self-reinforcing financial ecosystem.
Unlike Bitcoin, which primarily functions as a store of value, Ethereum captures value through:
- Transaction fees
- Smart contract execution
- Network usage growth
This creates a value accrual mechanism that strengthens over time as adoption increases.
Recent industry trends further support this:
- Expansion of tokenized treasury markets on Ethereum
- Increased institutional experimentation with RWAs
- Growth of Layer 2 scaling solutions reducing transaction costs
Together, these developments position Ethereum as the backbone of the emerging on-chain financial system.
6. Risks: Liquidity-Driven Rally and Potential Corrections
Despite its strong fundamentals, Ethereum’s rally is not without risks.
One concerning signal from March 2026 is that trading volume declined while prices increased. This suggests that:
- The rally may be driven more by liquidity conditions than strong spot demand
- Market depth may be limited
- Price movements could be vulnerable to external shocks
In such environments, sudden macro changes—such as interest rate shifts or regulatory developments—can trigger sharp corrections.
Investors should be aware that while Ethereum offers higher upside potential, it also carries higher downside volatility.
7. Strategic Positioning: ETH vs BTC in Portfolio Construction
From a portfolio perspective, Bitcoin and Ethereum now represent two distinct roles:
- Bitcoin (BTC):
Store of value, macro hedge, lower volatility anchor - Ethereum (ETH):
Growth asset, yield-generating infrastructure, higher volatility
This distinction is increasingly shaping institutional strategies, where portfolios are structured to balance:
- Stability (BTC)
- Growth and innovation (ETH)
In a liquidity expansion scenario, Ethereum is likely to outperform, while Bitcoin remains resilient during risk-off environments.
Conclusion: Ethereum’s Transition from Altcoin to Market Leader
March 2026 may be remembered as a turning point where Ethereum began transitioning from a secondary asset to a core driver of market dynamics.
The convergence of:
- Capital inflows
- Supply contraction
- Expanding ecosystem
creates a powerful foundation for continued growth.
While short-term risks remain, particularly around liquidity-driven volatility, Ethereum’s structural advantages position it as one of the primary beneficiaries of the next crypto market cycle.
If liquidity conditions improve, Ethereum is not just likely to participate—it may lead the next phase of digital asset expansion.
