
Main Points :
- Ethereum failed to break above $4,800 and pulled back ≈3 %, retesting key support near $4,400.
- On-chain data and derivatives metrics are conflicting: spot volume delta (CVD) is declining, while futures open interest remains elevated.
- A liquidity sweep near $4,400 (where many stops cluster) could trigger either a violent rebound or further drop to $4,100–$4,250.
- Ethereum exchange reserves have declined significantly, pointing to reduced sell-side pressure.
- Institutional flows, especially via ETFs, are becoming more relevant to ETH price dynamics.
- Some analysts foresee a longer-term bullish breakout (100 % from current) if ETH can confirm base formation.
- But downside risks remain: a failure to defend $4,400 may open room for decline toward $3,800–$4,100 zones.
Market Overview and Recent Pullback
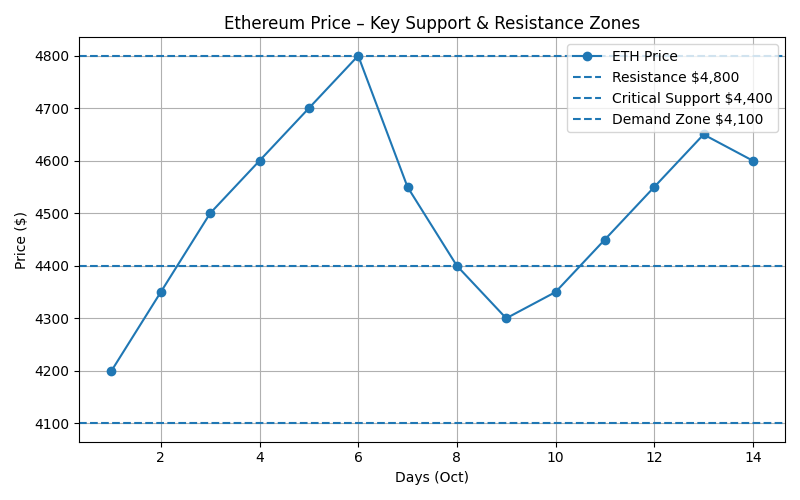
Ethereum (ETH) came into this week attempting to ride Bitcoin’s bullish momentum, but was unable to break decisively above $4,800. The failure triggered a ≈3 % drop, dragging ETH below $4,500 and bringing it to test support near $4,400.
Technical charts (4-hour timeframe) show a bearish divergence, where price makes higher highs, but momentum indicators (e.g. RSI, MACD) do not follow, signaling weakening upward strength. This is often a precursor to short-term reversal or consolidation phases.
Given this backdrop, the $4,400 zone is emerging as a make-or-break region: if buyers defend strongly, that could reset bullish momentum; if not, ETH may continue downward to test lower support levels.
On-Chain and Derivatives Data: Mixed Signals

Spot Volume & Cumulative Volume Delta (CVD)
In the spot markets, cumulative volume delta (CVD) has dropped sharply, suggesting net selling pressure. Many traders are taking profits, which weakens the base of buyers.
However, this view is contrasted by the derivatives side: futures open interest remains elevated, and futures-based CVD suggests that leveraged traders continue to place directional bets. This divergence between spot and derivatives shows that some participants expect volatility ahead.
Exchange Reserve Drain & Supply Dynamics
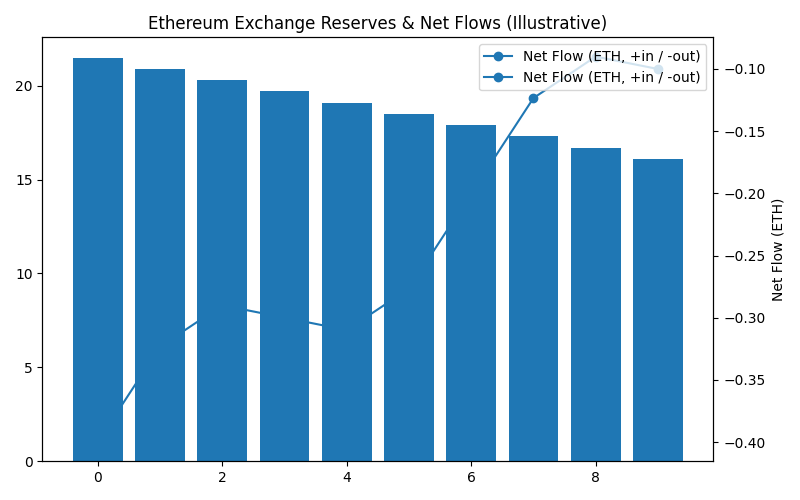
More structurally, Ethereum’s reserves on exchanges (i.e. ETH held in exchange wallets, available for selling) have declined to about 16.1 million ETH, representing a drop of more than 25 % since 2022. This reduction suggests less sell-side pressure available at current levels.
Net flows into exchanges remain negative, indicating ETH continues exiting exchanges toward staking, self-custody wallets, or other use cases. This shift effectively locks up supply, tightening available float.
Liquidity Sweeps and Price Behavior Around $4,400
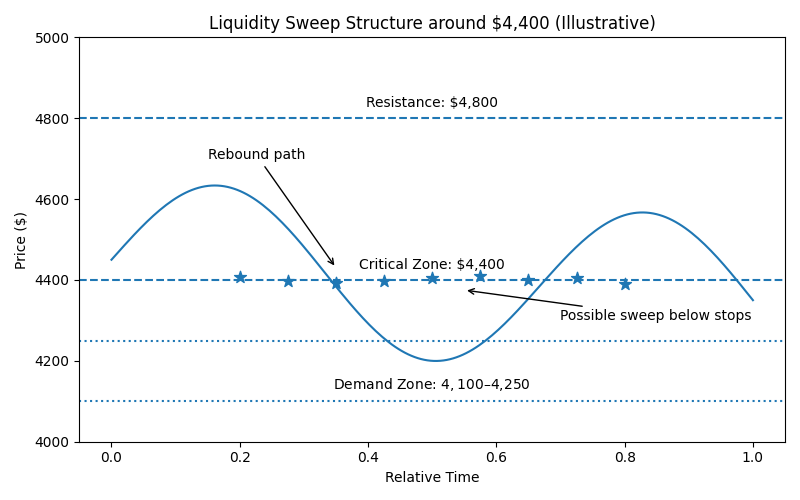
A central theme in this setup is liquidity sweeps—zones where many stop-loss or stop-limit orders are concentrated and can be “hunted” by larger players to trigger cascades of liquidations or momentum shifts. The $4,400 region is one such liquidity cluster.
If ETH drops slightly beneath $4,400 and triggers stops, it could accelerate downward momentum, dragging price toward the next demand zones (e.g. $4,100–$4,250). Conversely, a sharp bounce from $4,400 could neutralize the bearish case and reignite upward push.
Some analysts note that a “reset” through liquidity sweep—clearing weak hands before a renewed push—is common in high-volatility crypto moves, making the $4,400 region particularly strategic.
Macro, Institutional, and ETF Flows
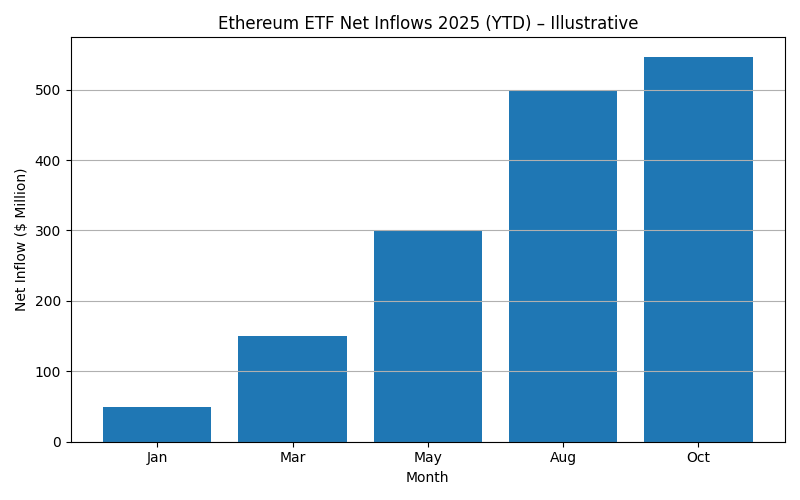
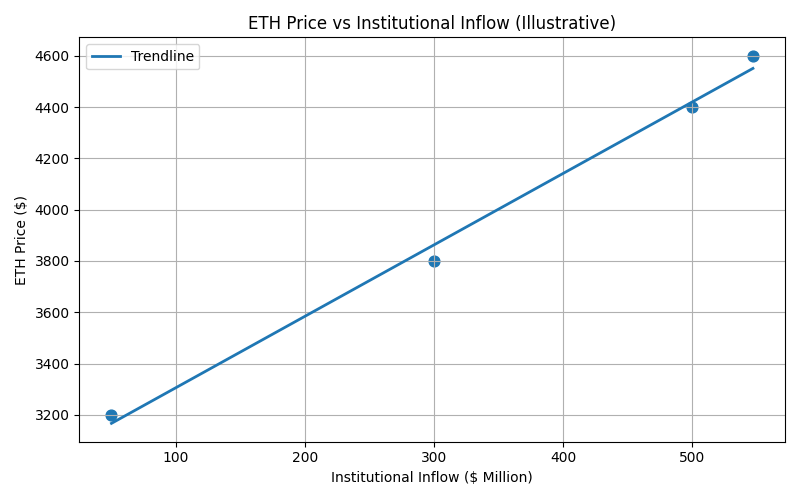
Beyond technical and on-chain metrics, institutional flows and ETF inflows are becoming key drivers of ETH price direction.
Recent reports suggest $547 million in inflows into Ethereum ETFs, coinciding with ETH reclaiming levels above $4,400. This suggests rising institutional interest and external capital supporting the market.
Additionally, some macro-level models and bank forecasts are turning bullish. For instance, Standard Chartered recently raised its year-end ETH target to $7,500, citing increased institutional adoption and ecosystem engagement.
On the other hand, Citi’s more conservative projection expects a year-end around $4,300, reflecting caution around regulatory and macro hurdles.
So, while institutional flows may tilt the sentiment upward, ETH still faces challenges from external macro, policy, and regulatory dynamics.
Scenarios and Price Projection Outlook
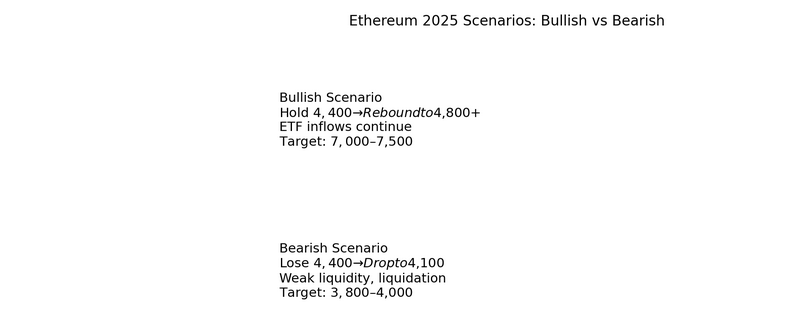
Bullish Scenario: Rebound from $4,400
If ETH holds the $4,400 zone and manages a sharp bounce (especially aided by institutional flows or positive news), price could push back toward resistance levels around $4,800 or higher. Some analysts also point to a “Power of 3” accumulation-to-distribution pattern, forecasting a potential 100 % rally (i.e. doubling) over months if confirmation occurs.
A clear move above $4,800 with volume and momentum could trigger a breakout into fresh high territory.
Bearish/Neutral Scenario: Failure to Hold
If ETH fails to defend $4,400 and breaks below with conviction, it could cascade toward $4,100–$4,250 or even deeper toward $3,800 in more aggressive corrections.
In that case, the market may consolidate, with insufficient impetus to resume a new leg up until a clear base is formed.
Sideways / Range-Bound
Given conflicting metrics, another plausible outcome is a range-bound consolidation between $4,200 and $4,800, where liquidity hunts and volatility spikes dominate short-term dynamics without a clear trend.
Practical Implications & Strategies for Investors
- Wait for confirmation: Rather than chasing short-term moves, it may be safer to await a decisive break or rebound around the $4,400 zone.
- Use liquidity zones: Entry or exit points could be structured around liquidity clusters (e.g. near $4,400, or around $4,100–$4,250) to mitigate downside risk.
- Monitor institutional flows: Watch ETF inflows, large wallet moves, and macro capital shifts as they may override technicals in volatile regimes.
- Manage leverage: With derivatives markets still active, overleveraging can lead to forced liquidations if structure breaks.
- Horizon matters: For longer-term investors, structural trends (e.g. reduced exchange reserves, protocol adoption) are more meaningful than short-term oscillations.
Conclusion
Ethereum currently sits at a precarious juncture. The inability to breach $4,800 has brought the $4,400 level into sharp focus as the line separating sustained bullishness from deeper correction. On-chain metrics (exchange reserve drain, negative net flows) suggest improving structural backing, yet near-term divergence between spot and derivatives markets introduces uncertainty.
A liquidity sweep around $4,400 could either shake out weak hands and pave the way for a rebound, or trigger cascading losses down to the $4,100–$4,250 range—or potentially lower. Institutional flows and ETF capital are increasingly critical variables that may tip the balance one way or the other.
For investors and practitioners seeking actionable entry points or new opportunities, this period demands discipline. Whether you’re scouting emerging crypto, designing blockchain use cases, or optimizing yield models, anchoring your decisions to structural data and liquidity dynamics is key.
In short: holding above $4,400 means bullish continuity is alive; losing it means caution—and patience—are paramount.
