Main Points :
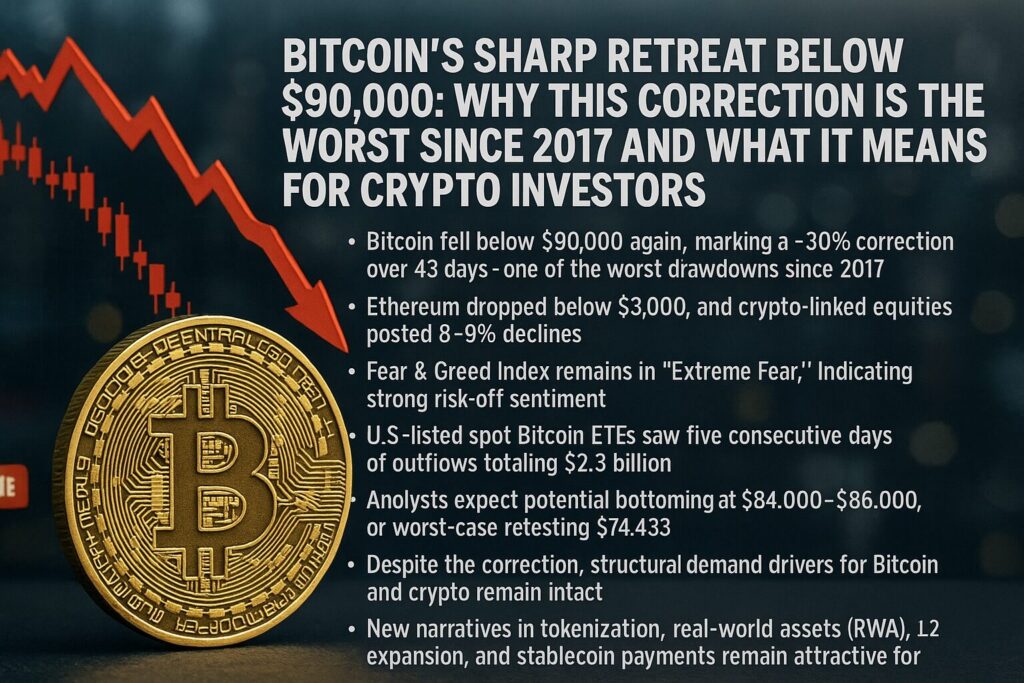
- Bitcoin fell below $90,000 again, marking a ~30% correction over 43 days—one of the worst drawdowns since 2017.
- Ethereum dropped below $3,000, and crypto-linked equities posted 8–9% declines.
- Fear & Greed Index remains in “Extreme Fear,” indicating strong risk-off sentiment.
- U.S.-listed spot Bitcoin ETFs saw five consecutive days of outflows totaling $2.3 billion.
- Analysts expect potential bottoming at $84,000–$86,000, or worst-case retesting $74,433.
- Despite the correction, structural demand drivers for Bitcoin and crypto remain intact.
- New narratives in tokenization, real-world assets (RWA), L2 expansion, and stablecoin payments remain attractive for investors seeking new opportunities.
1. Introduction: A Rally Interrupted
Bitcoin’s drop below $90,000 on November 19 shocked traders who had celebrated only a day earlier when BTC managed to rise even as U.S. equities sold off. For months, major stock indices regularly set new highs, while Bitcoin and the wider crypto market moved sideways. But when BTC finally showed relative strength against stocks on November 18, many saw it as confirmation of a new bullish leg.
Within 24 hours, however, that optimism evaporated.
Bitcoin fell 4.2%, sliding under $90,000; Ethereum dropped 6% to below $3,000; and publicly traded crypto companies posted even sharper losses.
The sudden reversal highlights a notable truth: although institutional adoption has transformed the market structure, Bitcoin remains vulnerable to macro shifts, ETF flows, and sentiment-driven movements.
2. Market Overview: Bitcoin and Ethereum Reverse Strong Momentum

On November 19:
- BTC: −4.2%, back under $90,000
- ETH: −6.5%, below $3,000
- Crypto equities: −8% to −9% (Strategy, BitMine, Circle, Bitfarms, Hive Digital)
While Nasdaq remained +0.2%, the divergence showed that crypto-specific risk factors—rather than broad market weakness—triggered the sell-off.
3. Chart: Illustrative Bitcoin Decline
Insert this chart here:
👉 Insert Figure 1: “Bitcoin Price Decline (Illustrative)”
(This figure visually represents the nature of the decline described in the article.)
4. Sentiment Breakdown: Extreme Fear Returns
Crypto’s popular Fear and Greed Index sits firmly in “Extreme Fear,” a zone associated with deep corrections and panic-driven selling. Historically, these periods often precede strong accumulation phases—but they also reflect elevated short-term volatility and a lack of buyers stepping in.
Reasons for fear include:
- Rapid unwinding of leveraged positions
- Weak ETF inflows and accelerating outflows
- Macro uncertainty despite rising equities
- Concerns that BTC’s October peak may represent a local top
5. Why This Correction Is Among the Worst Since 2017
Vetle Lunde of K33 Research notes that:
- The current ~30% decline over 43 days places this correction among the seven worst drawdowns since 2017 lasting over 50 days.
- In terms of magnitude, it resembles the sharp retracements following the 2017 blow-off top and the 2021 China mining ban adjustment.
This makes the correction historically significant, not just psychologically painful.
6. ETF Outflows Intensify Selling Pressure
Spot Bitcoin ETFs—once the market’s biggest bullish catalyst—have now become part of the problem.
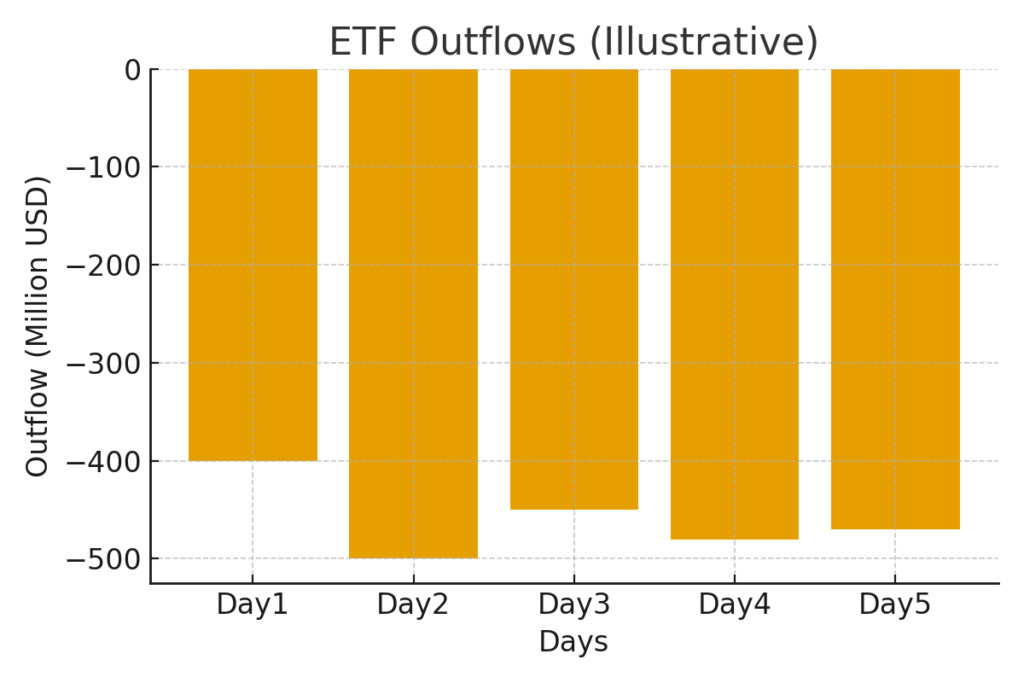
According to Farside Investors:
- Investors withdrew $2.3 billion over the last five trading days.
- Many ETFs are now trading below the average acquisition price of their BTC holdings.
- As long as ETFs bleed assets, Bitcoin faces mechanical sell pressure.
This outflow trend contrasts sharply with the powerful inflows earlier in the year that helped push BTC to its $126,000 all-time high in early October.
7. Where Could Bitcoin Bottom? Analyst Scenarios
Lunde outlines two main scenarios:
Scenario A – Local Bottom Around $84,000–$86,000
This range aligns with:
- Previous liquidity zones
- The typical depth of two similar corrections in the past two years
- Areas where long-term holders historically re-enter
Scenario B – Retest of $74,433
If bearish momentum accelerates:
- Re-visiting April’s lows becomes likely
- $74,433 is also the average acquisition price of Strategy’s BTC treasury
- Breaking below this would trigger additional technical selling
Both scenarios imply more volatility and potential capitulation before a full recovery.
8. What Does This Mean for Crypto Investors Seeking New Assets?
For readers exploring new crypto assets, income opportunities, or practical blockchain utility, this correction offers two key implications:
1. Blue-chip assets (BTC, ETH) are resetting risk levels
Deep corrections often precede major cycle expansions. BTC and ETH remain core exposure assets for most portfolios.
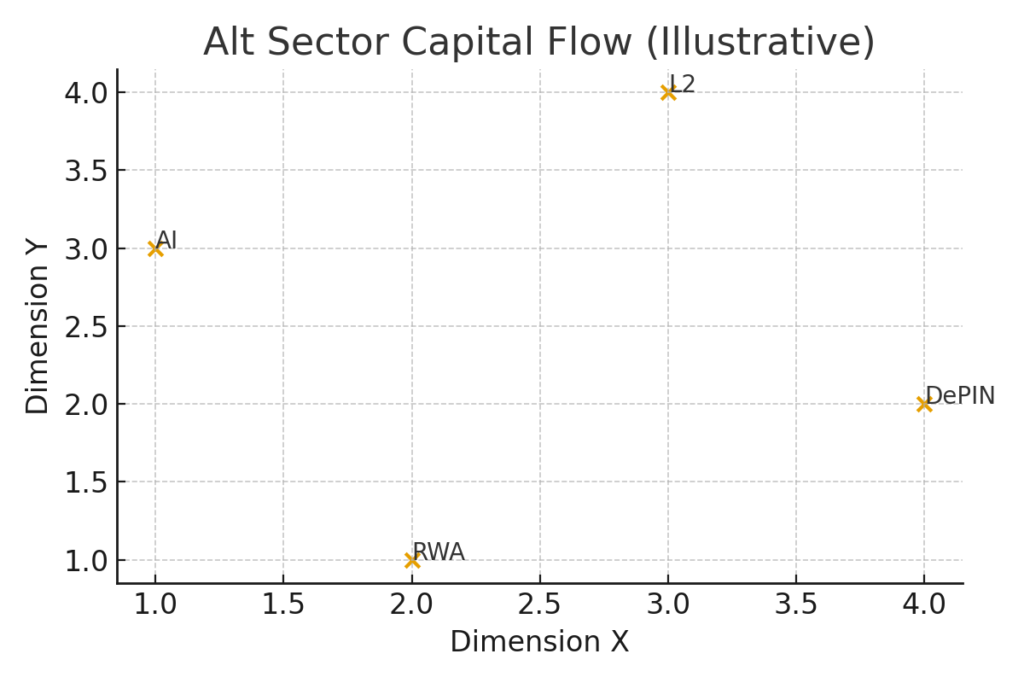
2. Growth narratives continue despite price declines
Even as prices fall, several sectors remain fundamentally strong:
- Real-World Assets (RWA) tokenization
- Stablecoin settlements and cross-border payment rails
- Layer-2 scaling for Ethereum and modular blockchains
- DePIN, distributed wireless and compute networks
- AI × blockchain convergence, especially around data verification
Investors often rotate into emerging assets while blue-chip coins consolidate.
9. Broader Market Comparisons: Why Crypto Corrected While Stocks Held Up
One of the article’s key observations is that Bitcoin fell even as U.S. stocks continued rising. This divergence suggests:
- ETF-driven flows now dominate BTC behavior more than macro correlations
- Crypto investors have become more sensitive to liquidity changes
- Traditionally bullish macro news no longer guarantees crypto strength
This marks an important shift from the “macro-driven market” of 2020–2023.
10. Opportunities Amid the Downtrend: Where to Look Next
Even during corrections, smart investors look for structural opportunity. Here are sectors currently showing the strongest momentum:
1. AI-linked tokens
AI computation, decentralized training, and verifiable data pipelines continue attracting institutional interest.
2. RWA (Real-World Assets)
Tokenized treasuries and cash instruments have exceeded $10 billion in circulating value.
3. Yield-bearing stablecoin platforms
These benefit from on-chain settlement and rising demand for transparent yield instruments.
4. Gaming & on-chain identity
Web3 gaming sees continuous VC investment even during downturns.
These sectors often recover earlier than BTC after major corrections.
11. Practical Blockchain Use Cases Strengthened by the Correction
Risk-off periods tend to highlight the practical value of blockchain:
- Cross-border payments become attractive as stablecoins outperform traditional remittance rails.
- Non-custodial wallets gain traction as traders seek sovereignty and security.
- Tokenized money market funds offer transparent, auditable yield.
- Decentralized storage & compute platforms grow as AI demand increases.
The market is maturing in ways that decouple utility from short-term price action.
12. Final Analysis: What Happens Next?
BTC’s drop below $90,000 is psychologically significant, but not structurally unusual in long-term cycles. Historically:
- A 30–40% correction after a new all-time high is common
- ETF outflows may be temporary
- Long-term holders continue accumulating
- New narratives drive adoption regardless of volatility
The next phase likely involves consolidation, re-accumulation, and potentially a strong finish to the cycle—especially as institutional infrastructure deepens globally.

Conclusion
Bitcoin’s current correction ranks among the most severe since 2017, but the broader crypto landscape remains full of innovation and emerging opportunities. For investors actively searching for new assets, revenue streams, and practical blockchain applications, this period is not a time to retreat—but to prepare. Historically, the most significant gains often follow during the recovery phase after deep corrections.
