Main Points:
- Bitcoin (BTC) in JPY showed heavy resistance at higher levels (~¥16.4M), weighed by whale sell‑offs despite rate‑cut hopes.
- A sell‑off of ~24,000 BTC by whales triggered downside, but support emerged near short‑term holders’ estimated average cost basis (STH Cost‑Basis).
- Fed Chair Powell signaled potential shift toward easing, underpinning USD and interest rates moves and giving BTC price support.
- STH cost‑basis is a critical technical level: price held just above it, suggesting continued bottoming and potential upside.
- On‑chain and macro trends (ETF flows, institutional demand, broader market forecasts) indicate both risks and opportunities for BTC moving forward.
1. Price Friction and Whale Sell-Off
This week, Bitcoin’s price against the Japanese yen remained capped below upper levels, trading around ¥16.4 million (approximately $110,000) as of August 29. After surging back toward ¥17 million following the Jackson Hole symposium, speculation of a whale disposing of roughly 24,000 BTC triggered a pullback between August 25–26, pushing prices down toward ¥16 million.
2. Short-Term Holder Cost-Basis Support
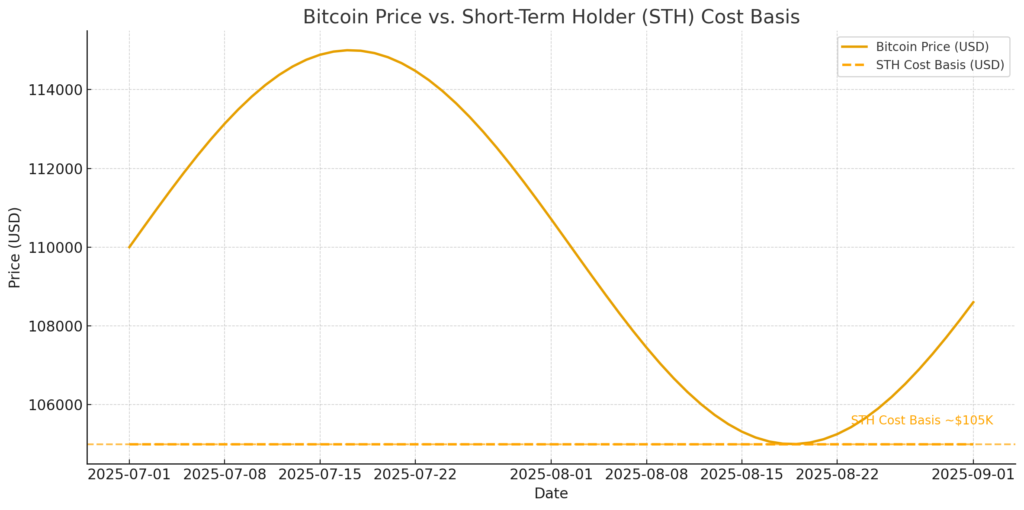
On‑chain data shows that such declines brought USD‑priced BTC close to the estimated average cost basis of short‑term holders (STH CB), inciting buy‑the‑dip behavior. This level often serves as a key support during rallies and resistance during declines. The brief dip near this threshold prevented further losses, bolstered by expectations of Fed easing and declining U.S. rates.
3. Fed Signals and Macro Undercurrents
At the Jackson Hole symposium, Federal Reserve Chair Powell suggested that policy may shift toward rate cuts if labor markets soften, easing inflation concerns. This boosted optimism in the market. With key U.S. data on the horizon—July PCE on August 29, August payrolls on September 5, and August CPI on September 11—the next FOMC (mid‑September) will be critically watched. Signs of a weaker jobs print may tip the scales toward rate reduction, providing further support to assets like BTC.
4. Technical Outlook and CME Gap
Amid subdued volatility, CME futures show an “open gap” that could allow BTC to recover toward around ¥17.2 million ($110–112K). While not a guarantee, historical patterns of gap fills suggest upside potential if sentiment remains favorable.
5. Broader On-Chain and Institutional Trends
Separately, over the past year, early‑stage Bitcoin whales have offloaded more than 500,000 BTC (≈$5 billion)—roughly matching net inflows into U.S. spot Bitcoin ETFs. At the same time, institutional actors have acquired about 900,000 BTC, now holding around 4.8 million BTC in aggregate—about a quarter of circulating supply.
Furthermore, on‑chain cost‑basis metrics underscore that price levels like $93K–$95K are structurally important, and ETFs, especially BlackRock’s IBIT, are driving notable accumulation.
Market forecasts vary: VanEck projects BTC could reach $180,000 by end‑2025, while resistance persists near ~$124K–126K, suggesting upside latter into the late‑year.
[STH Cost-Basis Chart]
Conclusion
Bitcoin’s price action this week encapsulates the tug-of-war between bearish impulses—namely hefty whale sell-offs—and bullish narratives, including rate-cut optimism and critical technical support at the short-term holder cost basis. The STH cost basis continues to act as a pivotal level, and as long as BTC remains above this line while macro variables tilt toward easing, the path to recovery remains viable. Institutional accumulation and ETF flows further bolster the long-term outlook, even as overhead resistance looms in the $124K–$126K zone. With U.S. economic data and FOMC decisions imminent, the market remains on edge but retains upside potential.
