Key Takeaways :
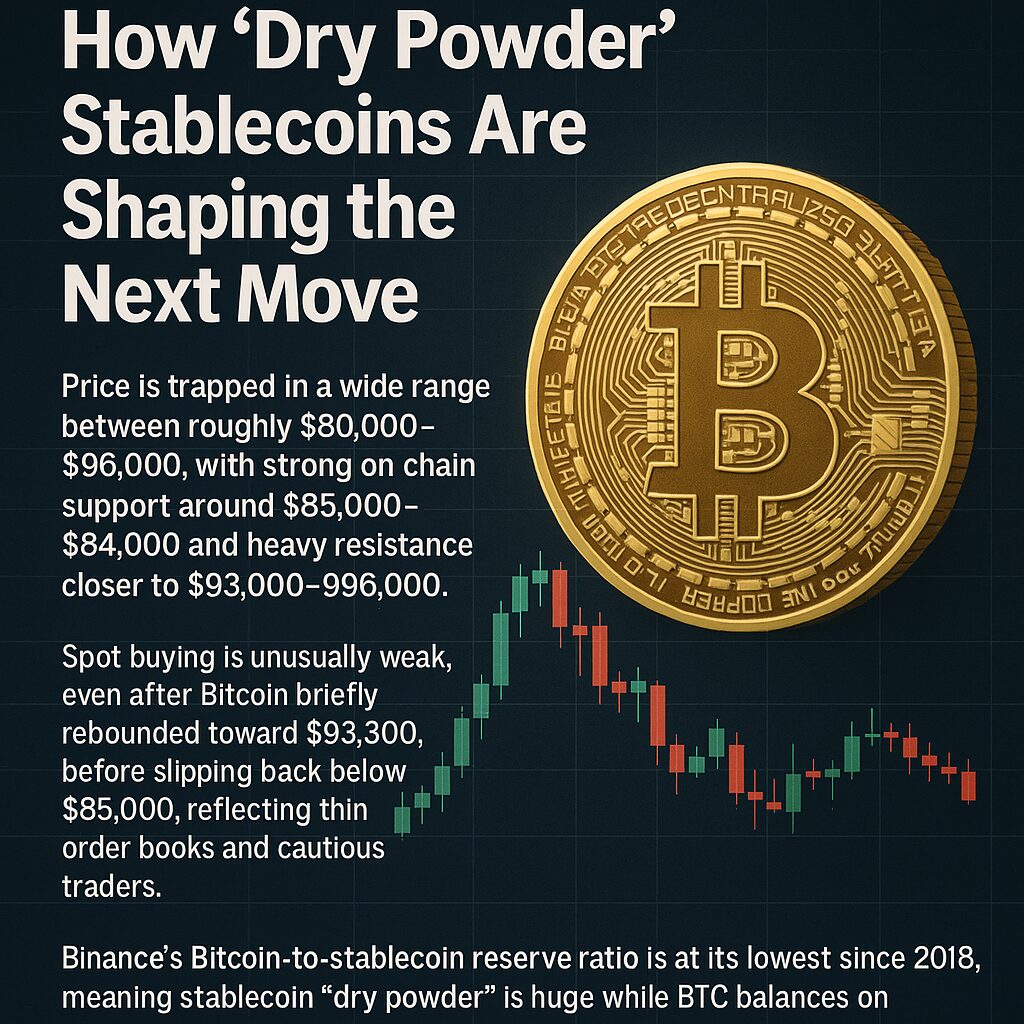
- Price is trapped in a wide range between roughly $80,000–$96,000, with strong on-chain support around $80,000–$84,000 and heavy resistance closer to $93,000–$96,000.
- Spot buying is unusually weak, even after Bitcoin briefly rebounded toward $93,300, before slipping back below $85,000, reflecting thin order books and cautious traders.
- Binance’s Bitcoin-to-stablecoin reserve ratio is at its lowest since 2018, meaning stablecoin “dry powder” is huge while BTC balances on exchanges are relatively low – a pattern that has often preceded large upside moves.
- US spot Bitcoin ETFs just had one of their worst months since launch, with around $3.5B of net outflows in November 2025, but ended the month with a small $70M inflow—a possible early sign that forced selling is easing.
- The next FOMC meeting on December 9–10, 2025 is a key catalyst: markets are pricing in a high probability of a rate cut, which could shift risk appetite for Bitcoin and other crypto assets.
- For investors looking for new assets, new revenue sources, and practical blockchain use cases, this period is less about chasing breakouts and more about positioning strategies: range trading, accumulation near on-chain supports, and scouting altcoins and infrastructure projects that benefit when liquidity finally rotates from stablecoins into risk assets.
1. Where Bitcoin Stands Now: A Market Caught Between Two Walls
The original Japanese article describes a Bitcoin market that tried to break higher, briefly pushing toward $93,300, but failed to sustain momentum and later fell back below $85,000. This behavior fits well with the broader data from late November and early December 2025:
- After touching levels above $100,000 earlier in the autumn, Bitcoin has retraced sharply, with lows near $81,000–$85,000 during the November sell-off.
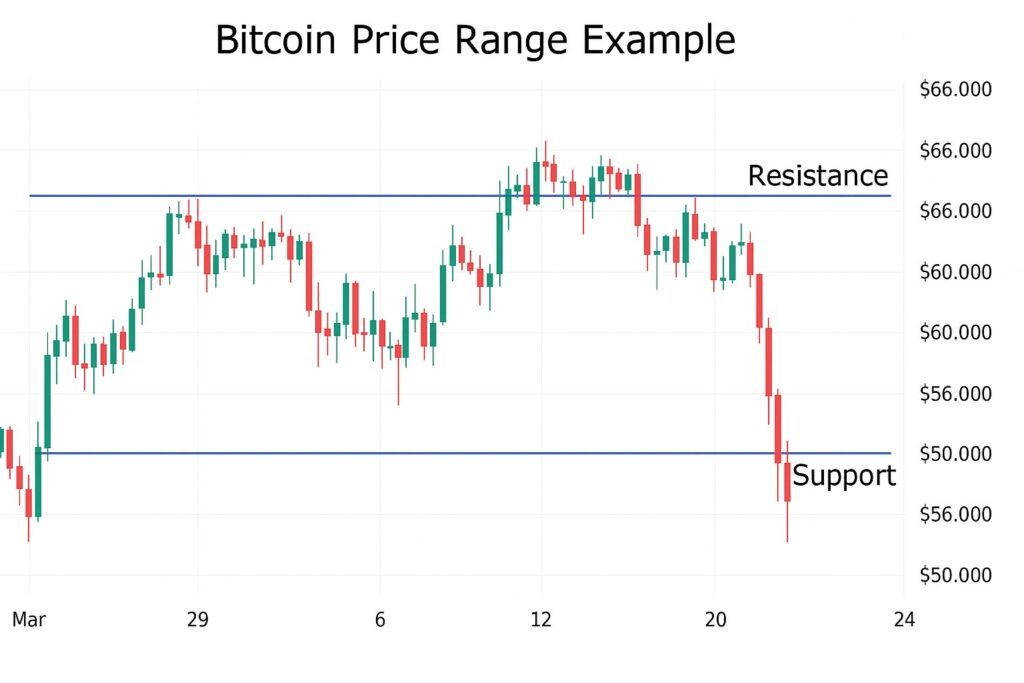
- Price is now oscillating in a broad band, roughly between on-chain support in the low $80,000s and resistance just under $96,000.
From a structural standpoint, two key zones matter:
- On-chain cost basis zone around $80,000–$84,000
- A large cluster of coins was acquired here, creating a deep realized price “floor” on the blockchain.
- This means many holders are still in profit or near break-even in this region, making them more willing to defend it with buy orders.
- Overhead resistance around $93,000–$96,000
- This region coincides with recent failed breakouts and liquidity pools of stop orders.
- Each approach to this band has triggered selling pressure, pushing BTC back into the range.
The Japanese article suggests that a constructive retest of the lower band ($80,000–$84,000) could strengthen the bullish case by absorbing sell-side liquidity before any sustainable push toward new highs. This aligns with common order-flow logic: strong moves usually launch after “cleaning up” both sides of the range.
2. Weak Spot Demand and Thin Order Books
A central point of the article is that spot buyers are unusually passive:
- Order books at major exchanges, including Binance, are shallow above $90,000–$93,000, so even modest market orders can cause sharp price spikes and reversals.
- Many short-term holders are sitting on unrealized losses relative to their average entry price (described in the article as around $104,600), making them reluctant to build new long positions.
This explains why attempts to break above resistance quickly fade:
- There simply isn’t enough spot buying power actively deployed at these levels.
- Price rallies encounter thin liquidity and run into profit-taking or defensive selling from traders worried about further downside.
For active traders, this environment:
- Rewards mean-reversion strategies (fading moves near the edges of the range) rather than momentum breakouts.
- Punishes late chasers who buy breakouts without confirming that spot flows and order book depth have truly improved.
3. The Hidden Giant: Stablecoin “Dry Powder” on Binance
The most important on-chain and exchange-level signal right now is the Binance Bitcoin-to-stablecoin reserve ratio:
- According to CryptoQuant, this ratio has fallen to its lowest level since 2018, meaning that BTC balances on Binance are relatively low compared to stablecoin balances.
- Historically, extreme lows in this ratio have preceded major Bitcoin rallies, because they signal that a large amount of “ready-to-deploy” capital is sitting in stablecoins, waiting for the right trigger to rotate into BTC.
In other words:
- Current spot demand looks weak, but this weakness is deceptive.
- Under the surface, buyers are loaded with stablecoins and simply waiting for better entry conditions—whether that’s a deeper dip toward $80,000 or a macro signal (like a Fed rate cut).
This is especially relevant for investors seeking new revenue opportunities:
- It suggests that the bull cycle may not be over, but is in a liquidity pause.
- Once these stablecoin reserves begin to rotate into spot purchases, they can fuel rapid moves not only in BTC but also in high-beta altcoins.
4. ETFs, Liquidity, and Institutional Behavior
To add context from other sources, we need to look at the US spot Bitcoin ETF market, which now acts as a major channel for institutional demand:
- In November 2025, US spot Bitcoin ETFs saw approximately $3.5B in net outflows, their worst month since February.
- This coincided with Bitcoin’s sharp drawdown from above $100,000 to the low $80,000s.
- However, near the end of November, ETFs logged a rare $70M inflow in a single day, suggesting that forced selling might be easing and some institutional buyers are beginning to step back in.
Even after the outflows:
- Spot Bitcoin ETFs still hold over $110B in net assets, representing around 6–6.5% of Bitcoin’s market cap, meaning they remain a structural pillar of demand even in corrective phases.
For practical investors:
- ETF outflows can amplify short-term downside, but they also flush out leveraged or momentum-driven positions, paving the way for healthier accumulation.
- Watching ETF flows alongside Binance stablecoin data offers a powerful two-lens view: one for institutional US demand, one for global crypto-native capital.
5. FOMC: Why December 9–10 Matters So Much
The article notes that Bitcoin may continue ranging until the next Federal Open Market Committee (FOMC) meeting, scheduled for December 9–10, 2025.
Recent macro research from major banks strengthens this view:
- J.P. Morgan and Bank of America both now expect the Fed to cut rates by 25 bps at the December meeting, reversing earlier expectations of a delay.
- Futures markets are pricing in a high probability (around 85–88%) of a December rate cut.
For Bitcoin and broader crypto:
- A rate cut typically reduces the opportunity cost of holding non-yielding assets like BTC and may support risk assets if the market perceives it as a controlled easing rather than a panic response.
- However, the impact is path-dependent:
- If the Fed emphasizes slowing growth and rising risks, markets might initially react with risk-off sentiment despite the cut.
- If the Fed signals confidence and a gradual normalization, it could unlock pent-up stablecoin liquidity sitting on exchanges.
This uncertainty explains why many traders are unwilling to take big directional bets before the meeting and prefer to trade the range instead.
6. What This Means for Investors Looking for New Crypto Opportunities
Your target readers are not just Bitcoin maximalists; they’re looking for:
- New assets
- New income streams
- Practical blockchain applications
In the current environment, several strategies and themes stand out.
6.1. Range-Based BTC Strategies
While Bitcoin is stuck between $80,000–$96,000, traders can:
- Use spot or low-leverage futures to accumulate near the lower bound (around $80,000–$84,000) and trim exposure near the upper bound.
- Sell options (for advanced users) to monetize the expectation of continued consolidation until the FOMC meeting.
- For more conservative investors, dollar-cost averaging (DCA) near on-chain support zones can smooth entry risk.
6.2. Positioning for the Next Liquidity Rotation
When stablecoins start rotating into risk assets, high-beta segments typically move first and fastest:
- Layer-1 and Layer-2 ecosystems with strong DeFi and NFT activity.
- Infrastructure tokens linked to scaling (rollups, interoperability, modular blockchains).
- Real-world asset (RWA) platforms and payment-oriented tokens that benefit from higher on-chain transaction volumes.
Given the current data:
- The stablecoin “dry powder” on Binance suggests that once a clear macro signal emerges, these segments could experience aggressive capital flows, offering new revenue sources via:
- Yield farming (with smart contract and regulatory risk).
- Providing liquidity to decentralized exchanges.
- Participating in staking or restaking protocols where network fundamentals justify the yield.
7. Practical Blockchain Use Cases in a Sideways Market
A sideways Bitcoin market doesn’t mean blockchain adoption stops—in fact, it often shifts focus from speculation to utility. Builders and investors can look at:
- Cross-border payment solutions using BTC, stablecoins, or L2s, where transaction costs and predictability matter more than short-term price swings.
- Stablecoin-based treasury and cash-management products for SMEs and individuals, which become more attractive when USD yields start to fall after rate cuts.
- Tokenized treasury bills or real-world assets, which can offer on-chain, dollar-denominated yields while keeping settlement native to blockchain rails.
- Non-custodial wallets and compliance-aware infrastructure (Travel Rule, KYT integration, etc.), which will be essential as regulation tightens during the next wave of institutional adoption.
For readers actively building products (like non-custodial wallets or EMI/VASP solutions), this environment is a good window to focus on infrastructure, compliance, and UX, while market prices consolidate.
8. Risk Management: What If the Bearish Scenario Plays Out?
Not all analysts are optimistic. Some recent pieces frame a $50,000 downside scenario as “inevitable” if liquidity remains poor and macro data disappoints.
Key risks:
- Deeper ETF outflows if December brings another volatility spike.
- A more hawkish-than-expected Fed, delaying rate cuts despite market expectations.
- Regulatory shocks (for example, around stablecoins or large exchanges) that freeze the flow of capital.
Practical steps:
- Avoid excessive leverage in a thin liquidity environment.
- Size positions under the assumption that a temporary cascade toward $60,000–$70,000 is possible, even if it’s not the base case.
- For builders and long-term investors, treat such events as stress tests and potential accumulation opportunities rather than existential threats.
9. Conclusion: Consolidation as a Setup, Not a Verdict
Putting everything together:
- Bitcoin’s failed breakout near $93,300 and subsequent drop below $85,000 reflect weak active spot demand and thin order books, not necessarily a collapse of the bull cycle.
- On-chain and exchange data reveal a record-low Binance BTC/stablecoin reserve ratio, meaning massive stablecoin reserves are waiting on the sidelines—a configuration that has historically preceded major upside moves.
- US spot Bitcoin ETFs just endured heavy November outflows (~$3.5B) but still hold over $110B in net assets, underscoring that institutional infrastructure is intact and may resume net buying once macro uncertainty clears.
- The December 9–10 FOMC meeting is a natural pivot point: a widely expected rate cut could catalyze a rotation from stablecoins into BTC and altcoins, while a surprise or a hawkish tone could prolong the consolidation or trigger one more flush.
For your readers—those seeking new assets, new income streams, and real-world blockchain applications—this is not a time to switch off. It is a time to:
- Refine range-based BTC strategies
- Prepare watchlists of high-conviction altcoins and infrastructure projects
- Develop or adopt practical, compliance-ready blockchain tools that will still matter when the next wave of liquidity finally hits
The market may look quiet on the surface, but structurally, capital is gathering at the edges of the range. When it moves, it is likely to move fast—and those who used this consolidation window to plan, build, and allocate thoughtfully will be in the best position to capture the next phase of the cycle.
