Main Points :
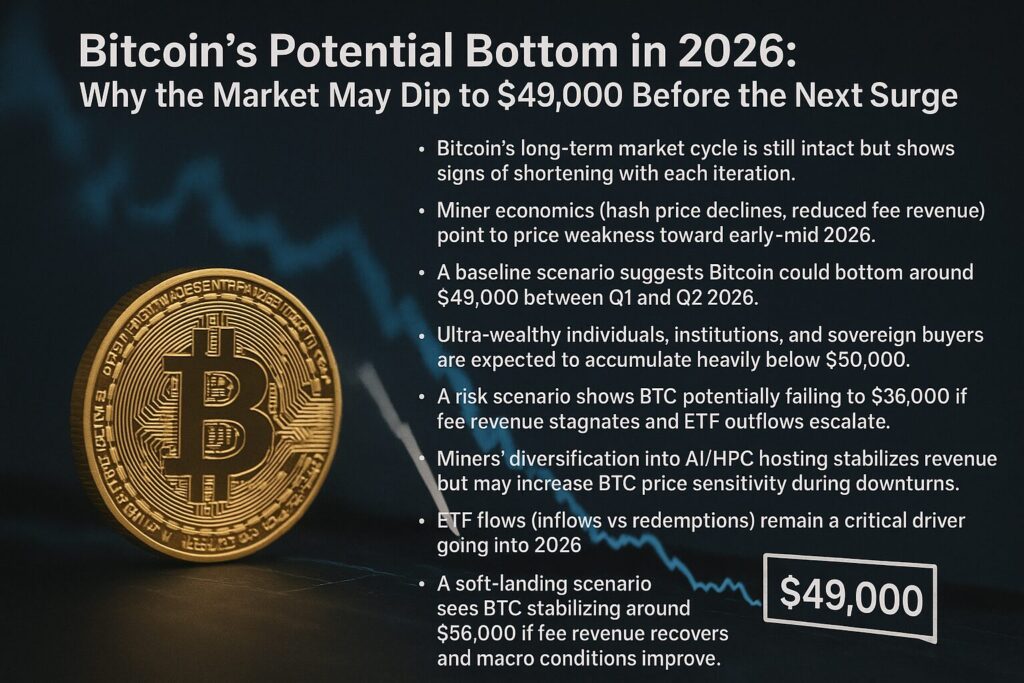
- Bitcoin’s long-term market cycle is still intact but shows signs of shortening with each iteration.
- Miner economics (hash price declines, reduced fee revenue) point to price weakness toward early–mid 2026.
- A baseline scenario suggests Bitcoin could bottom around $49,000 between Q1 and Q2 2026.
- Ultra-wealthy individuals, institutions, and sovereign buyers are expected to accumulate heavily below $50,000.
- A risk scenario shows BTC potentially falling to $36,000 if fee revenue stagnates and ETF outflows escalate.
- Miners’ diversification into AI/HPC hosting stabilizes revenue but may increase BTC price sensitivity during downturns.
- ETF flows (inflows vs redemptions) remain a critical driver going into 2026.
- A soft-landing scenario sees BTC stabilizing around $56,000 if fee revenue recovers and macro conditions improve.
1. Introduction — A Market Approaching Its Next Structural Pivot
Bitcoin’s market structure continues to evolve as institutional adoption spreads and miner economics adjust to shifting revenue sources. The latest analyses from multiple research groups—including miner economic analytics, ETF flow surveillance, and macro-cycle studies—suggest that Bitcoin may face a deeper correction before entering its next expansion phase.
Unlike previous long and brutal bear markets, recent cycles show signs of becoming shorter and more compressed. Nonetheless, structural forces still indicate that a meaningful bottom could form sometime in early to mid-2026, with prices potentially reaching the $49,000 range based on mainstream projections.
This article synthesizes the referenced report with current macroeconomic indicators, ETF capital movements, miner profitability metrics, and new developments across AI-adjacent mining businesses. It offers a fully contextualized outlook designed for investors seeking new revenue opportunities, altcoin discoveries, and practical blockchain applications.
2. Market Cycle Dynamics — Compressing but Still Predictable
Recent years reveal that Bitcoin’s multi-year market rhythm remains intact but is gradually compressing. Several factors contribute to this phenomenon:
2.1 Faster Information Flow
The presence of ETF-driven liquidity, large institutional traders, and public macro-driven sentiment cycles accelerates both euphoric rallies and sharp corrections.
2.2 Reduced Retail Lag
In contrast to 2017 or 2021, information about Bitcoin spreads far more quickly, reducing lag between news events and price responses. The result: shorter but more intense cycles.
2.3 Miner Behavior
Miners have become more financially sophisticated, employing hedging tools, risk-management strategies, and diversified revenue sources. This reduces forced selling—except in extreme downturns.
Together, these elements imply that while Bitcoin continues to follow predictable post-halving patterns, the length of each market cycle appears to be shrinking, setting the stage for a volatile 2025–2026 environment.
3. Miner Economics — The Core Driver of the Coming Downtrend
Bitcoin’s projected decline toward $49,000 is closely tied to miner balance sheets. Miner economics now depend heavily on:
- Hash price decline (the revenue miners earn per hash)
- Fee revenue, which surged during the inscription mania but later collapsed
- Electricity and operational costs
- Alternative revenue streams (AI/HPC hosting)
3.1 Fee Revenue Collapse Weakens the Mining Sector
The surge in blockspace demand due to inscriptions previously provided a vital financial buffer. However, as inscription activity declined, miner fee revenue regressed to historical norms, weakening their resilience.
This is crucial:
Without sufficient transaction fees, miners become increasingly reliant on block subsidies—which continue to decrease every halving cycle.
3.2 Diversification into AI and High-Performance Computing
Companies such as TeraWulf are expanding into AI and HPC hosting.
This approach creates two effects:
| Positive Impact | Negative Impact |
|---|---|
| Stabilizes miner revenue | Makes miners less sensitive to BTC price declines, delaying capitulation |
| Creates new business lines | When capitulation finally occurs, it may trigger sharper BTC selloffs |
| Reduces dependency on BTC fees | Hash-rate adjustments can happen more rapidly, increasing market volatility |
Paradoxically, diversification makes the network more resilient but the price more fragile.
3.3 How Miner Stress Leads to a $49,000 Bottom
Analysts estimate that miner capitulation patterns (based on hash-rate drawdowns and miner reserve declines) will align between 2026 Q1 and Q2, producing a soft bottom around $49,000.
Institutional buyers are expected to enter heavily below $50,000, seeing BTC less as a trading instrument and more as a strategic long-term asset.
4. ETF Flow Scenarios — The New Macro Driver
Bitcoin ETFs have permanently changed BTC price mechanics. Their flows now act as daily sentiment indicators for institutional demand.
4.1 Scenario A — ETF Outflows Accelerate During Declines
If BTC falls from current levels:
- Risk-averse investors may redeem ETF positions
- Fund managers could be forced to sell physical BTC
- Price declines could intensify into a downward spiral
This is the scenario that could lead to $36,000.
4.2 Scenario B — ETF Investors Buy the Dip
If institutional strategies treat sub-$50,000 levels as an opportunity:
- ETF inflows could stabilize the market
- The bottom could rise toward $56,000
- Volatility may decrease as long-term buyers accumulate
ETF reaction will define whether Bitcoin reaches a deep bottom or forms a soft landing.
4.3 Historical Comparison
Research on ETF behavior across traditional markets (gold, SPY, QQQ) shows:
- Large outflows typically occur during systemic shocks
- Moderate corrections often attract inflows
Thus, macroeconomic conditions will heavily influence Bitcoin’s ETF-driven flows into 2026.
5. Macro Risks — The Bearish Scenario ($36,000)
A severe macro downturn—triggered by tightening liquidity, recessionary signals, or deleveraging in global markets—could push Bitcoin deeper into a bearish channel.
The worst-case scenario includes:
- ETF outflows persisting for months
- Miners forced to liquidate reserves
- Retail sentiment collapsing
- Volatility rising
- Hash-rate dropping significantly
This could create a temporary but painful bottom around $36,000, though such levels are expected to be short-lived due to strong strategic buying interest.
6. Strategic Buying Zone — Why $49,000 Matters
The area below $50,000 is historically significant:
- Sovereign wealth funds
- Institutional treasuries
- Ultra-high-net-worth individuals
- Long-duration investment funds
These groups view Bitcoin as a long-term strategic reserve asset.
For them, entry below $50,000 represents a high-conviction opportunity.
This aligns with:
- Long-range stock-to-flow projections
- Hash-ribbon capitulation signals
- Miner revenue compression cycles
- ETF accumulation patterns
The $49,000 region is therefore not just a technical target—it’s a fundamental turning point.
7. Soft-Landing Scenario — Stability at $56,000
If network fees improve and ETF flows stabilize, Bitcoin may find equilibrium around $56,000.
Key requirements for this scenario:
- Inscription or L2 activity revives blockspace demand
- AI/HPC diversification stabilizes miner balance sheets
- ETF flows remain neutral or positive
- Macro conditions avoid severe tightening
While less likely than the baseline scenario, this outcome remains plausible.
8. Outlook for Investors Searching for New Crypto Opportunities
For investors seeking:
- new altcoin opportunities
- early-stage tokens
- scalable blockchain solutions
- practical applications of DeFi and Web3
- strategic long-term BTC positions
…the 2025–2026 window may present the best accumulation opportunity before the next expansion cycle.
BTC volatility will also create capital rotation toward:
- mid-cap Layer-1s
- execution-focused Layer-2s
- AI-integrated blockchain infrastructure
- utility-driven DePIN projects
- restaking ecosystems
9. Conclusion — A Bottom That Creates the Next Cycle
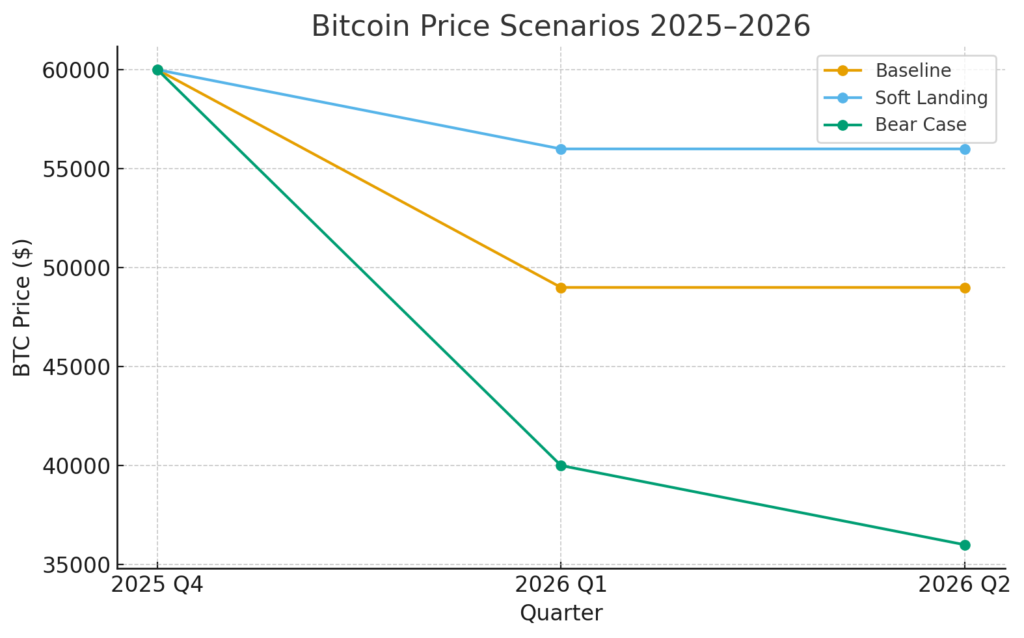
Most models now converge on a simple but powerful narrative:
- Baseline: Bitcoin bottoms around $49,000 in 2026 Q1–Q2
- Soft Landing: Stabilization at $56,000
- Bear Case: Sharp but temporary plunge toward $36,000
The next major rally depends on:
- miners regaining financial strength
- ETF flows turning positive
- macroeconomic stabilization
- renewed blockspace demand
For strategic investors, a deep 2026 bottom may represent the final major opportunity before the next exponential phase of Bitcoin’s adoption curve.
