Main Points :
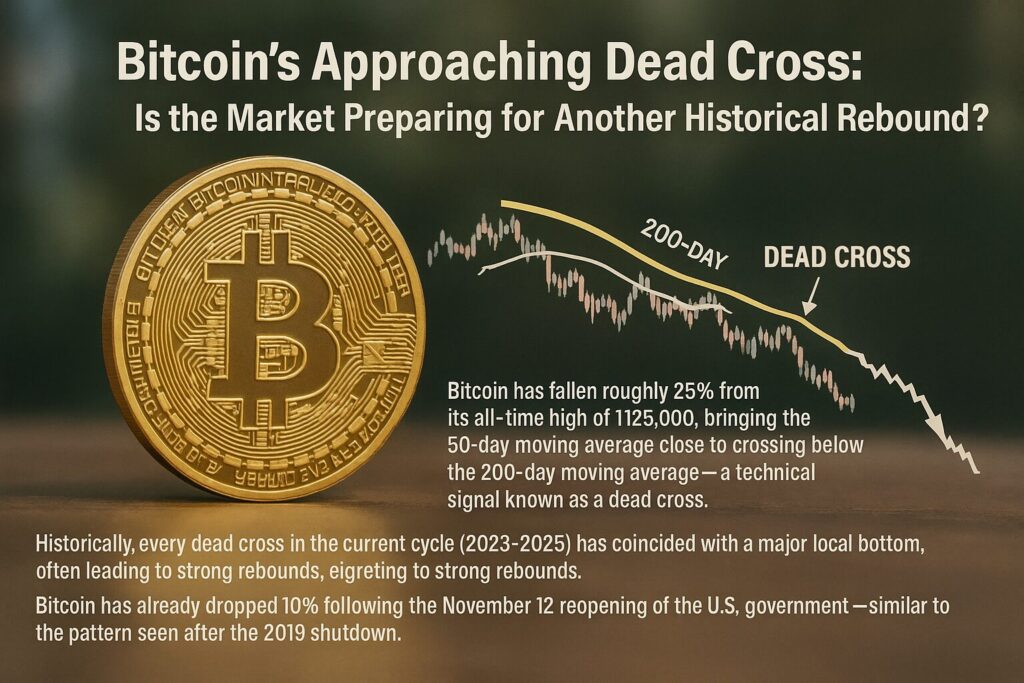
- Bitcoin has fallen roughly 25% from its all-time high of $126,000, bringing the 50-day moving average close to crossing below the 200-day moving average—a technical signal known as a dead cross.
- Historically, every dead cross in the current cycle (2023–2025) has coincided with a major local bottom, often leading to strong rebounds.
- The current decline resembles past corrections triggered by policy shifts, macroeconomic shocks, or government shutdowns.
- Bitcoin has already dropped 10% following the November 12 reopening of the U.S. government—similar to the pattern seen after the 2019 shutdown.
- Despite bearish sentiment, market structure data, miner behavior, and liquidity flows suggest that long-term bullish fundamentals remain intact.
Introduction: A Familiar Technical Pattern Returns
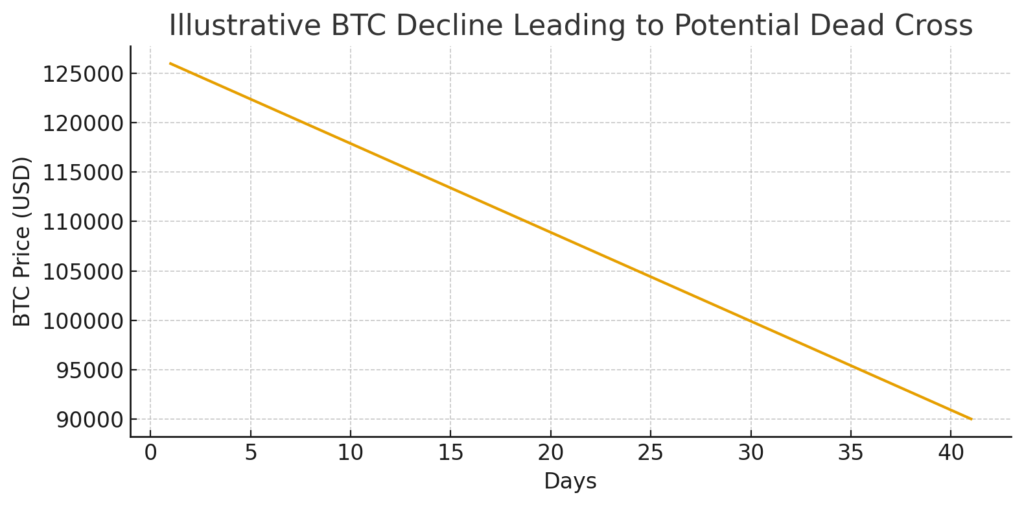
Bitcoin’s price structure is once again entering a technically sensitive zone. After reaching an all-time high near $126,000, the asset has retraced approximately 25%, positioning its 50-day moving average (50-DMA) on the verge of crossing below the 200-day moving average (200-DMA). This pattern—known as a dead cross—typically indicates weakening short-term momentum relative to long-term trends.
However, historical precedent suggests that dead crosses in Bitcoin markets often arrive after the bulk of the correction has already unfolded. Since 2023, every confirmed dead cross has aligned with a local price bottom, prompting debate among analysts: is the upcoming dead cross a sign of further downside, or a signal that the correction is nearly complete?
To answer that question, this article summarizes the referenced report, integrates additional context from recent market developments, and presents a structured examination of Bitcoin’s cyclical behavior heading into late 2025.
1. Understanding the Dead Cross: Why It Matters
A dead cross is created when the 50-DMA falls below the 200-DMA. Traders interpret this event as a shift in momentum toward the downside, often triggering algorithmic selling or risk-off positioning.
1.1 Historical Accuracy in Bitcoin
While dead crosses are considered bearish in traditional equities, Bitcoin behaves differently because of its high volatility and reflexive market structure. In the ongoing 2023–2025 cycle, Bitcoin has produced three major dead crosses:
- September 2023 – Bottom around $25,000
- August 2024 – Bottom around $49,000
- April 2025 – Bottom under $75,000
In all cases, prices rebounded significantly within weeks after the cross was finalized.
1.2 Why This Cross May Repeat the Pattern
Current price action supports the historical pattern:
- The decline has lasted 41 days, shorter than the 79-day slide earlier in 2025.
- The depth of the correction (25%) is milder than previous cycle drawdowns, which ranged from 30% to 40%.
- Funding rates and futures open interest have reset to neutral, suggesting leveraged long positions have already been flushed out.
Thus, while the dead cross signals caution, it may also indicate that the market is completing its corrective phase.
2. Comparison With Earlier Corrections
2.1 April 2025: The Tariff Shock Correction
The most recent deep correction occurred in April 2025, when uncertainty surrounding President Trump’s tariff policies triggered a risk-off rotation. Bitcoin plunged nearly 30% from $109,000 to below $75,000.
That correction lasted longer (79 days) and cut deeper than the current drawdown, making the present decline appear structurally milder.
2.2 2024 Yen Carry Unwind
In August 2024, Japan’s reversal of ultra-loose monetary policy caused the yen carry trade to unwind. Bitcoin fell from $63,000 to $49,000, marking the cycle’s second major local bottom.
The market recovered quickly as liquidity conditions stabilized—another sign that Bitcoin rebounds strongly when macro shocks subside.
3. Government Shutdown Effects: A Repeating Pattern?
3.1 What Happened in 2019
When the U.S. government reopened in January 2019, Bitcoin fell 9% within five days and required nearly three weeks to recover.
Today’s situation resembles this pattern:
- Shutdown ended on November 12, 2025
- Bitcoin has already dropped 10% since that event
- Risk sentiment remains fragile as markets digest the economic cost of the closure
While not identical, the correlation suggests that government shutdown shocks tend to coincide with short-term price weakness followed by recovery.
4. Evaluating On-Chain Indicators
Beyond price and moving averages, on-chain data provides deeper insight into Bitcoin’s market positioning.
4.1 Miner Behavior
Miner selling pressure appears moderate:
- Miner outflows are tracking neutral levels
- The hash rate remains near cycle highs
- No major capitulation event has occurred
This indicates miners are not under severe financial stress.
4.2 Long-Term Holder Supply
The supply held by long-term holders (LTHs) is near record highs, meaning experienced investors are accumulating rather than distributing.
4.3 Exchange Liquidity
Spot exchange balances continue trending downward, reinforcing the long-term bullish thesis that holders are moving coins to self-custody.
5. Broader Market Trends: Altcoins, Stablecoins, and Institutional Flows
5.1 Altcoin Rotation
During Bitcoin corrections, capital often migrates into altcoins with strong narratives:
- AI tokens remain highly active with rising developer activity
- Real-world asset (RWA) platforms continue onboarding tokenized treasury products
- Layer-2 ecosystems are reporting sustained growth in active addresses
This rotation pattern suggests liquidity has not left the crypto market—only repositioned.
5.2 Stablecoin Expansion
Stablecoin supply has expanded by over $20 billion in 2025, signaling fresh capital entering the ecosystem.
5.3 Institutional Activity
ETF flows slowed after October’s peak, but pension funds and sovereign entities in Asia continue adding BTC exposure on dips.
These structural inflows reduce the probability of deeply extended corrections.
6. What Happens Next? Scenario Analysis
6.1 Bullish Scenario
If the dead cross marks another local bottom:
- Support at $94,000 holds
- A gradual recovery toward $110,000–$115,000 begins
- Altcoins outperform during the rotation phase
- New market narratives (AI-RWA synergy, hybrid rollups) accelerate capital inflows
6.2 Bearish Scenario
If macroeconomic data weakens and liquidity tightens:
- Price could retest $88,000 or $82,000
- A deeper flush could occur before renewed accumulation
- Options markets price higher late-cycle volatility
6.3 Most Likely Case
Based on historical analogues and current indicators:
The probability favors short-term volatility followed by a medium-term recovery, consistent with previous dead-cross cycles.
Conclusion: A Historically Bullish Bearish Signal
While the term dead cross evokes fear in traditional markets, Bitcoin’s unique market structure often flips this signal into a precursor of recovery. The combination of:
- Reduced leverage
- Strong long-term holder conviction
- Expanding stablecoin liquidity
- Institutional buying behavior
- Historical bottom-forming dead crosses
suggests that the ongoing correction may be closer to its end than its beginning.
Investors searching for new opportunities—whether in Bitcoin, emerging altcoins, or blockchain-driven revenue strategies—should view this period not only as a cautionary signal, but also as a potential entry window consistent with past cycles.
