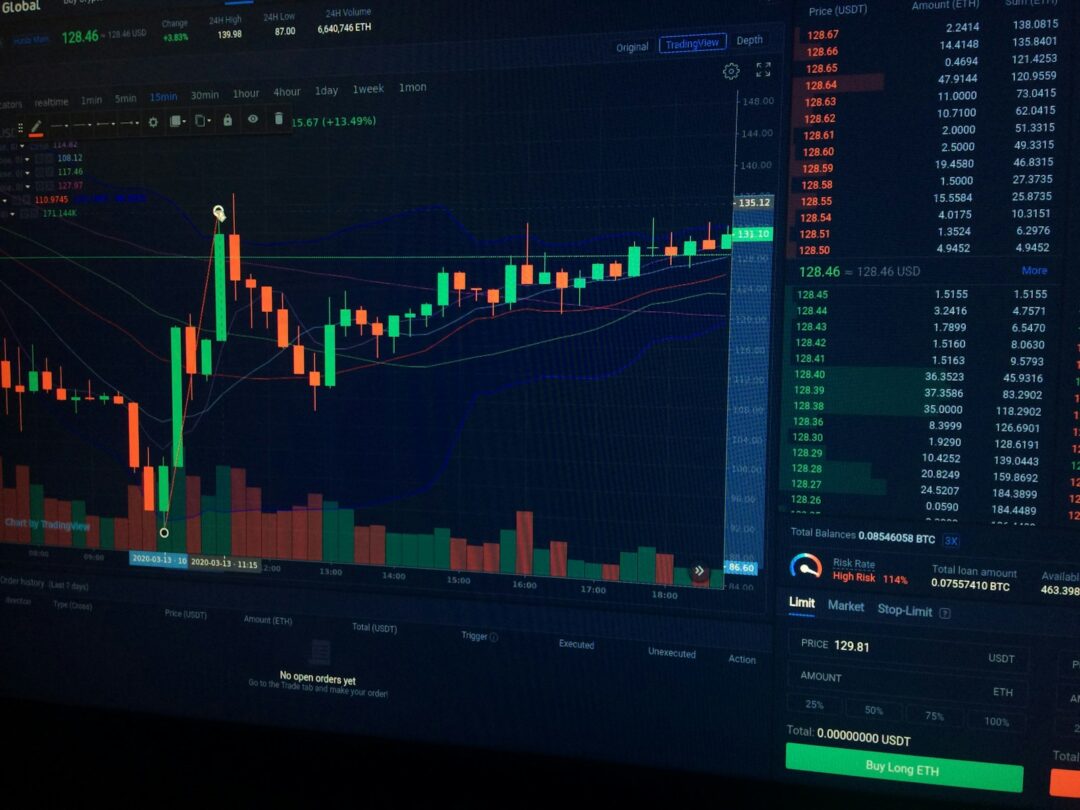
Market Overview
The cryptocurrency market enters Monday, November 23, 2026, facing a distinctly different question from the one that dominated last week. The immediate issue is no longer simply whether prices can survive another forced liquidation cascade. It is whether the rebound from Saturday’s two-year bitcoin low can attract durable, unleveraged demand when American equity markets reopen and a compressed Thanksgiving trading calendar begins. A weekend recovery demonstrates that sellers did not retain uninterrupted control. It does not, by itself, establish a new investment cycle or the restoration of institutional risk appetite.
In an early-Asian-session observation for this edition, CoinGecko showed bitcoin around $60,970, up about 1.3% over 24 hours but down approximately 6.2% over seven days. Ethereum stood near $1,721, up 2.7% on the day and lower by 5.6% over the week. XRP changed hands around $0.9259, down about 0.5% in 24 hours and 4.2% in seven days. These are moving reference quotations, not synchronized exchange execution prices; the publication’s analytical cutoff is the November 23 Asian morning, before the forthcoming U.S. cash-market session.
Market capitalization underlines the scale of the correction. CoinGecko placed bitcoin’s market value near $1.23 trillion, ether’s near $210 billion and XRP’s near $58.8 billion. Corresponding reported 24-hour trading volume was approximately $27.4 billion, $7.8 billion and $1.05 billion. Volume figures aggregate reported activity across venues; they do not measure executable liquidity at a specific price or the amount available without slippage. A thinner order book can coexist with sizable turnover when large sellers repeatedly cross spreads.
The weekend break was severe. Reuters reported on November 21 that bitcoin fell to $55,251.60, its lowest level in two years, then recovered more than 8% to around $59,952. This is the material event against which Monday’s movement should be judged. A rebound of several thousand dollars after a rapid collapse is consistent with forced positioning being unwound and short-covering developing. It is not proof that the earlier holders have rebuilt exposure, nor that higher prices can be sustained when futures leverage returns.
Institutional flows offered no clear confirmation before the weekend. Farside’s U.S. bitcoin ETF ledger showed a completed aggregate outflow of $582.3 million for Thursday, November 19, including $541.1 million from BlackRock’s IBIT, followed by a reported $124.5 million outflow for Friday, November 20, with IBIT still unreported. That missing cell is not zero. A final Friday industry total therefore cannot be calculated from the displayed ledger. The last fully populated session, not the superficially newer partial figure, provides the firmer comparison.
Ether funds tell a similarly qualified story. Farside’s ether ETF table lists a fully populated $131.2 million net withdrawal on November 19, substantially associated with a $124.2 million outflow from ETHA. Its November 20 row contains unreported entries for major issuers and a displayed negative $13.2 million aggregate, which must be read as partial rather than reconciled. Comparing that incomplete amount to a completed day would exaggerate any apparent improvement. The discipline matters because ETF flow narratives often travel faster than issuer-level reporting.
Sentiment remains depressed even though spot prices have recovered from Saturday’s extreme. The Alternative.me Crypto Fear & Greed Index showed a latest observed reading of 11, categorized as extreme fear. That indicator combines market and behavioral measures; it is neither a survey of professional investors nor a forecast of the next price move. Extreme readings can precede short-lived rebounds, extended consolidation or further declines. They describe the condition in which decisions are being made, not their inevitable outcome.
The macroeconomic environment is unusually important for a twenty-four-hour market facing a closed traditional-market weekend. U.S. ten-year Treasury yields ended Friday, November 20, around 4.92%, down from 5.04% on Thursday; the two-year yield was about 4.63%, according to Treasury yield-curve reporting. Falling yields on a single day should not be confused with a completed easing cycle. Borrowing costs remained high, the dollar had been relatively firm over the preceding weeks, and investors were reassessing capital expenditure and earnings assumptions in the artificial-intelligence sector.
This week’s calendar may turn the rebound into a test of cash-market confirmation rather than purely cryptocurrency-native dynamics. The November U.S. flash purchasing managers’ indexes are scheduled for Monday, November 23; consumer confidence follows Tuesday, and Wednesday brings important U.S. growth and personal-consumption-expenditure data. Thursday’s Thanksgiving holiday closes the U.S. stock market, with an early close Friday. These are scheduled releases and closures, not outcomes known at this cutoff. The shortened trading week can amplify moves because market makers, funds and hedgers have fewer conventional-market sessions to rebalance.
Bitcoin Market Analysis
BTC Narrative
Bitcoin’s recovery above the $60,000 threshold is notable precisely because the weekend low was not an ordinary intraday pullback. The descent through the $57,742 area cited by Reuters on Friday accelerated into Saturday’s $55,251.60 trough before reversing. The move exposed the vulnerability of portfolios that had treated the summer trading range as a durable floor. A level that formerly attracted dip-buying can become an overhead supply zone when recent buyers seek to reduce losses on the first meaningful bounce.
The strongest factual support for stabilization is the visible recovery in spot reference prices, not a claim that new large buyers have permanently absorbed the supply. CoinGecko’s observed 24-hour range of roughly $58,696 to $61,447 situates bitcoin inside a recovery channel rather than above it. A spot price around $60,970 sits above the psychological $60,000 mark and close to the upper part of that range. Even so, it remains well below levels traded earlier in November and has not yet invalidated the prior week’s pattern of falling peaks.
ETF redemption behavior distinguishes this episode from an exclusively offshore derivatives event. Farside records Thursday’s $582.3 million bitcoin fund outflow and an earlier $306.5 million outflow on Wednesday, November 18, following $239.9 million on Tuesday, November 17. The Tuesday-to-Thursday sequence was not uniform across individual issuers, and it included offsetting subscriptions. Nevertheless, net selling from listed U.S. funds coincided with weaker market liquidity and created a credible institutional channel through which changes in investor allocation affected the broader spot market.
Thursday’s issuer-level profile was particularly concentrated. IBIT accounted for $541.1 million of net redemptions, while Fidelity FBTC lost $45.9 million, ARKB $31.3 million and GBTC $13.9 million. Morgan Stanley’s MSBT showed a positive $49.6 million flow, indicating that not every wrapper experienced withdrawals. Reporting net results instead of treating each fund’s movement as identical is essential: a large withdrawal from one high-volume fund can dominate the daily total, and fund-level heterogeneity influences how market makers source bitcoin and manage inventories.
Friday’s Farside line, by contrast, must be treated as an incomplete snapshot. Reported movements include a $72.4 million withdrawal from FBTC, $32.8 million from GBTC, $12.9 million from the Grayscale mini bitcoin fund and a $2.3 million subscription into MSBT. With IBIT absent, the posted negative $124.5 million figure is not a reliable completed-market aggregate. It would be misleading to characterize Friday as a decisive flow improvement or deterioration on that basis. A reconciled update is a meaningful Monday research priority, not a number that can be inferred from a dash.
The macro transmission is also more specific than a generalized description of investors becoming nervous. Reuters connected the slide to investors questioning the prospective returns from large artificial-intelligence infrastructure spending, high borrowing costs and wider equity volatility. When expected technology-sector profits are revised, leveraged portfolios may sell the assets that remain most liquid around the clock. Bitcoin can consequently weaken before a cash equity session begins and rebound when the most urgent collateral adjustments are completed. The timing can create the appearance of an independent crypto signal even when the initiating risk comes from outside crypto.
An important distinction is the relationship between bitcoin’s dollar price and portfolio stress. The market’s denomination in dollars makes changes in U.S. rates and the dollar relevant, but the effect is neither mechanically fixed nor immediate. Higher real yields can raise the opportunity cost of non-yielding holdings, while a stronger dollar constrains the purchasing power of non-dollar investors. Conversely, a flight into Treasury securities may lower nominal yields without becoming a risk-on event. For bitcoin, the joint behavior of yields, credit conditions, equities and actual ETF subscriptions matters more than any one macro series.
There is also an institutional calendar asymmetry. Cryptocurrency venues operate continuously, while U.S. ETF share creation, redemption and most cash-market hedging are concentrated in American business hours. A Saturday rebound cannot be checked against fresh U.S. ETF inflows until the next trading day. Monday’s relevant question is whether bitcoin holds the recovery when those channels reopen, not whether Saturday’s price rise was large in isolation. Reliable observation requires matching fund-session dates to price data and avoiding comparisons between a current spot quote and an incompletely reported prior fund session.
BTC Technical & Liquidity Structure
The immediately observable bitcoin structure consists of a sharp capitulation low, a recovery through $60,000 and a still-unrepaired decline from the preceding trading week. The $55,250 area corresponds to Reuters’ November 21 reported low and serves as the clearest recent downside reference. Above it, $57,700–$58,700 covers the broken Friday threshold and the lower end of CoinGecko’s more recent 24-hour trading range. These are descriptive zones based on observed prices, not exchange-verified concentrations of standing buy orders.
On the upside, $61,450–$62,000 combines the upper boundary of the observed 24-hour range with the next widely watched round-number area. A sustained break would improve the local recovery pattern but would not restore November’s broader structure. The $64,000–$65,000 region is a more demanding secondary test because trading was substantially higher before the weekend rout. The market could approach either zone through short-covering alone, so evidence of actual spot turnover and depth around the attempted breakout is important.
Liquidations underscore why a price chart by itself can overstate the significance of a rebound. Liqwall’s November 21 venue-aggregated record reports approximately $582 million of bitcoin liquidations that UTC day, divided between $362 million of longs and $220 million of shorts. Its methodology and exchange universe are not identical to all-market CoinGlass headline estimates. Other widely circulated figures refer to rolling 24-hour windows, which can overlap and cannot legitimately be added together. A falling open-interest base and rapid liquidations indicate de-risking, not necessarily a fresh wave of directional cash buying.
A separate account of derivatives data collected into early November 22 noted weaker Binance bitcoin open interest and funding that moved from slightly positive Saturday settlements to negative around midnight UTC Sunday. The venue and contract matter: Binance BTCUSDT perpetual positioning is not the same as the total bitcoin derivatives market, and negative funding measures the relative cost of long and short exposure rather than predicting price direction. The combination suggests the rebound was occurring in an environment where some leverage had been reduced. It does not tell us whether the remaining market is adequately liquid.
CoinGecko’s approximately $27.4 billion bitcoin turnover was lower than its preceding-day comparison, while the price recovered. Lower turnover following a crash can represent the exhaustion of forced orders, temporary reluctance to trade or thinner weekend participation. Those mechanisms have different implications. A robust recovery should ultimately withstand rising cash-market participation and renewed ETF reporting, rather than relying on a quiet book to mark prices higher. Traders should also avoid interpreting a localized exchange-pair dislocation as the consolidated global bitcoin price.
BTC Forecast
The base case is an unstable consolidation between roughly $58,700 and $62,000 while participants assess Friday’s unfinished ETF figures and the first U.S. trading session after the collapse. A market holding $60,000 on a closing basis and repeatedly recovering from intraday dips would strengthen this interpretation. It would be weaker if trading volumes fade while leveraged open interest quickly rebuilds in one direction. These conditions describe how the scenario could be assessed; they do not assert that Monday’s outcome is known.
In the upside case, bitcoin absorbs selling around $61,450–$62,000 and advances toward $64,000–$65,000 as cash markets stabilize, bond yields remain contained and reconciled fund flows become less negative or turn positive. An improvement that depends only on short covering is less compelling than one accompanied by stronger spot depth and balanced funding. A durable reclaim of $65,000 would represent a more substantive repair than an isolated tick above $62,000.
The downside case begins with a failed return above $60,000 and a slide below $58,700. That would expose the $57,700 area and then the $55,250 weekend low. A new break of that low could trigger additional collateral adjustments, although no exact liquidation threshold can be verified from publicly observed prices. Renewed technology-stock weakness or adverse U.S. inflation information would be potential accelerants rather than proven causes of a move that has not happened.
For risk interpretation, the decisive sequence is price behavior, spot participation, institutional flow confirmation and macro conditions in that order of observation. Bitcoin can rally on weak flows, and its funds can register outflows on a day when the price recovers. Neither outcome is contradictory because market prices reflect many channels, including inventory transfers and derivatives hedging. The forecast remains conditional until Monday’s cash-market evidence can be separated from weekend positioning.
Ethereum Market Analysis
ETH Narrative
Ethereum has joined bitcoin’s rebound but faces a different allocation problem. CoinGecko placed ether around $1,721, with a 24-hour gain of 2.7% and a seven-day decline of approximately 5.6%, compared with bitcoin’s 1.3% daily rise and 6.2% weekly loss in the same observation. Ether’s near-term relative performance cannot erase the pressure imposed by a lower price base, softer institutional allocations and a market in which financing and collateral costs have become more important to portfolio construction.
The structural difference from bitcoin is that ether represents exposure to a programmable settlement network, with economic activity affected by transaction fees, application demand, staking arrangements and the competitive position of alternative platforms. None of those functions creates a guaranteed short-term support price. In a broad de-risking episode, investors often simplify portfolios by selling higher-beta crypto exposures together. Ethereum’s fundamental use cases can remain intact while its liquid token is repriced sharply because portfolios are reducing exposure to volatile assets as a class.
A direct institutional indicator is the U.S. spot ether ETF ledger. Farside reports a completed $131.2 million withdrawal on November 19, with $124.2 million leaving ETHA, $5.2 million leaving ETHE and $1.8 million leaving ETHB. Wednesday, November 18, showed a completed $39.8 million outflow. These flows reflect transactions in investment products, not an exact measure of every institution’s ether holdings. They nevertheless suggest that the product channel had not become a consistent stabilizer before the weekend rout.
Friday’s apparent improvement is subject to an even stronger qualification than bitcoin’s. The Farside ether table displays an aggregate negative $13.2 million for November 20 but has no reported values for ETHA, ETHB and FETH. It is therefore not a completed aggregate and must not be described as the industry’s finalized cash flow. An issuer’s silence is not a subscription of zero dollars. The next comprehensive data refresh may revise the market’s impression of whether the previous withdrawal sequence was easing.
The relationship between ETF demand and staking also deserves precision. Some regulated funds and wrappers incorporate staking arrangements or seek to offer staking exposure, while others do not. These differences can affect how investors compare expenses and prospective returns, but they do not make ETF flows interchangeable with total on-chain staking activity. A change in a wrapper’s outstanding shares is not automatically equivalent to coins leaving or entering the validator set. Analysts should inspect each fund’s mandate and disclosures before claiming that ETF redemptions signal a direct deterioration in Ethereum’s network security.
Ethereum’s realized trading volume was approximately $7.8 billion over 24 hours in the observed CoinGecko snapshot, against a market value around $210 billion. That turnover supplies evidence of continuous participation but does not establish that order-book depth has returned to pre-selloff levels. A price recovery on lower activity could reflect the reduced urgency of weekend selling. Sustained improvement would require buyers willing to transact when U.S. stock-market stress, interest-rate pricing and the new week’s ETF redemption figures are visible together.
Broader capital-market conditions matter because ether’s risk premium can be sensitive to competing expected returns. Investors comparing ether with yield-bearing fixed income or public equities must account for token volatility, execution liquidity, custody, regulation and the uncertain translation of application growth into token demand. At a high ten-year Treasury yield, the opportunity cost of holding a volatile asset remains prominent. A single decline in yields on Friday may relieve pressure without overturning the concerns that dominated the prior week’s allocation decisions.
ETH Technical & Liquidity Structure
Ethereum’s latest observed 24-hour trading range was approximately $1,646–$1,726. The lower boundary is the first nearby evidence-based support reference, while $1,700 is a practical short-term pivot rather than a mathematically proven floor. The zone from $1,725 to $1,750 is the immediate upside test, combining the recent high with the next round-number band. A close above it would improve the local recovery but leave the market well below previous levels traded earlier in the month.
Further resistance near $1,800–$1,850 should be regarded as a conditional recovery target, not a validated concentration of resting limit orders. On the downside, a failure at $1,650 could invite a retest of the $1,600 region and, in a renewed stress event, the approximate $1,540–$1,550 zone reported in recent price histories. The distance between these zones is substantial relative to the current price, which makes position sizing and available liquidity more consequential than the precision of a chart line.
Ethereum derivatives can magnify movements because leveraged contracts require margin independently of whether the underlying network continues operating normally. When the price falls rapidly, collateral requirements may lead to forced selling, causing liquidations to arrive in clusters. As prices recover, those positions are not necessarily re-established immediately. There is insufficient consistently timed cross-exchange evidence in this edition to assign one definitive current ether open-interest number or funding rate, and no such value should be inferred from bitcoin futures statistics.
Confirmation would come from price staying above the first support band while spot volumes and fund flows improve without an aggressive acceleration in speculative leverage. Conversely, a fast rally with an immediate rise in perpetual-futures premiums and little improvement in cash-market bids would warrant caution. Relative strength against bitcoin can help interpret rotation into ether, but both assets can advance together during a broad relief rally without a meaningful change in the underlying market regime.
ETH Forecast
The base case for ether is consolidation in the $1,650–$1,750 area as the rebound encounters the first overhead supply created by the prior week’s losses. The positive daily change is encouraging but has to be reconciled with the week’s negative return and finalized November 19 institutional withdrawals. Sustained closes over $1,700 with orderly funding would be more useful evidence than a brief rise on illiquid weekend order books.
The upside scenario requires ether to clear approximately $1,725–$1,750 and then establish the $1,800–$1,850 region as a viable objective. It would be supported by resilient U.S. equities, less pressure on real yields and completed ETF reports showing a materially better balance of subscriptions and redemptions. Those drivers are not guaranteed to occur together; a rebound led by one may fade if another deteriorates. Treat the higher band as a conditional projection, not a precise price target.
The downside case would become more credible if ether loses $1,650, fails to recover it and breaks toward $1,600, followed by the lower $1,540–$1,550 reference in a broad risk-off continuation. The central issue is the market’s ability to absorb spot sales without an accelerating derivatives feedback loop. Network-development optimism cannot substitute for this immediate test of tradable liquidity, just as a declining token price alone does not demonstrate a network failure.
XRP Market Analysis
XRP Narrative
XRP has lagged the strongest parts of the weekend rebound. CoinGecko’s observed quotation of approximately $0.9259 represented a 0.5% decline over 24 hours and a 4.2% decline over seven days, contrasting with positive daily moves for bitcoin and ether. The price remained in a narrow observed 24-hour range of roughly $0.9111–$0.9367. This relative weakness matters because XRP’s market structure and investment narrative depend on a different mixture of exchange liquidity, payment-technology adoption expectations, issuer disclosures and speculative positioning.
The distinction between XRP and Ripple-related business developments remains important. A payment partnership, custody initiative or legal development involving a company in the ecosystem is not automatically a transaction that creates token demand at the same scale. Analysts must identify the mechanism: whether an announcement changes accessible liquidity, regulatory certainty, actual settlement volume, treasury allocation or simply market perception. In a period of generalized risk reduction, a favorable narrative without measurable market adoption may have limited capacity to offset portfolio selling.
Institutional XRP products present a smaller and more fragmented evidence base than the longer-established bitcoin and ether ETF complexes. One ETF dashboard displayed an estimated negative $5.3 million flow for November 20, while another issuer-file tracker reported a different partial subset awaiting a fund’s update. These readings differ in included issuers and reporting completeness. Neither should be represented as a single independently reconciled, industry-wide figure until the universe and all missing files are matched.
The uncertainty illustrates a broader methodological point. For an ETF series, investors need to know the products included, whether creations and redemptions are measured in dollars or in underlying tokens, how price changes affect valuation and whether reporting gaps are being treated consistently. A day of limited flow could appear favorable relative to bitcoin simply because several XRP issuers have not reported. An unverified comparison would obscure rather than illuminate the actual strength of demand.
XRP’s reported 24-hour market turnover of around $1.05 billion and market capitalization near $58.8 billion show an active traded asset, yet they are not evidence that a large order could be executed at the reference price without moving the market. Market makers may widen spreads during periods of volatility, especially in pairs with smaller local order books. The relevant question for the early Monday session is whether volume supports a recovery above the recent high, or merely reflects repeated churn within the same narrow band.
Regulatory developments and institutional product structure are especially relevant to XRP because changes in the availability of custodial and exchange-listed exposure can alter its investor base. But there was insufficient verified evidence at this cutoff for a new regulatory approval or finalized aggregate product-flow number that would warrant declaring a fresh catalyst. An appropriate assessment therefore places more weight on the observed market behavior and on the known timetable for upcoming U.S. data than on unverified forward-looking claims about product launches.
The market’s immediate comparison with bitcoin may also be revealing. A broad recovery normally improves many digital assets, but the magnitude and durability of individual gains vary with their trading depth and holder composition. If bitcoin maintains $60,000 while XRP repeatedly fails at $0.94, the divergence may indicate that buying interest is concentrated in the most liquid benchmark rather than expanding across the sector. That would be consistent with caution, not necessarily with an XRP-specific deterioration in its underlying payments technology.
XRP Technical & Liquidity Structure
XRP’s recent range gives an observable first layer of technical references. The $0.91–$0.92 area corresponds to the lower portion of CoinGecko’s 24-hour band, while $0.936–$0.94 marks its upper boundary. A sustained move above $0.94 would distinguish an attempted recovery from sideways activity. The wider $0.97–$1.00 zone is a plausible next test because it combines a recent higher-price region with a round-number psychological threshold, not because a precise volume profile has confirmed an order cluster there.
A break beneath $0.91 would weaken the near-term consolidation case and shift attention toward $0.88–$0.86, an area present in recent broader trading histories. It is more responsible to describe this as a scenario range than to present $0.8600 as an exact stop or liquidation point. Aggregate account leverage and exchange-specific forced-liquidation thresholds are not sufficiently observable from the current available source set. Market depth may change substantially even while the quoted last trade barely moves.
In percentage terms, XRP can experience large relative swings without the large dollar moves associated with bitcoin and ether. From approximately $0.926, a decline to $0.86 is materially significant for a leveraged position. Likewise, a rebound toward $1.00 would require a larger proportional advance than its eight-cent distance might suggest. This asymmetry should encourage analysis in percentage risk and trading liquidity, not only absolute price intervals.
The key technical confirmation would combine a break through $0.94, improved spot turnover and sustained follow-through after American trading resumes. A failed test near that level and a return below $0.91 would argue that sellers retain control of the immediate range. No conclusion should be drawn from a single exchange’s thin fiat pair, just as no global price trend should be inferred from one anomalous print during a volatile weekend.
XRP Forecast
The XRP base case is a holding pattern between roughly $0.91 and $0.94 while bitcoin tests whether its own rebound can withstand Monday’s return of U.S. ETF and equity trading. Positive sentiment from the larger crypto benchmarks may help, but the current daily divergence argues against assuming automatic catch-up performance. A neutral outlook becomes more credible when prices repeatedly defend the lower band without sharp increases in leveraged participation.
The upside case would require a convincing move above $0.94 and then a recovery toward $0.97–$1.00, ideally accompanied by clearer XRP product-flow disclosures, consistent venue liquidity and better general risk appetite. This scenario does not require an invented regulatory announcement. It requires confirmation that prospective buyers are actually meeting offered supply at progressively higher prices. If the price rises without these observations, the distinction between sustainable demand and temporary short covering remains unresolved.
The downside case involves a loss of the $0.91 zone and pressure toward $0.88–$0.86, particularly if bitcoin revisits its weekend lows or global risk assets sell off again. A sudden reversal in the dollar or Treasury curve could add volatility but should not be described as a verified cause until it occurs. The practical forecast is about conditions that would invalidate the near-term range, rather than a point estimate of where XRP must trade at a predetermined hour.
Key Levels and Forecast Table
| Asset | Current Area | Key Support | Key Resistance | Base Case | Upside Scenario | Downside Scenario |
|---|---|---|---|---|---|---|
| BTC | Around $60,970 | $58,700–$60,000; $57,700 | $61,450–$62,000; $64,000–$65,000 | $58,700–$62,000 consolidation | $64,000–$65,000 after $62,000 holds | $57,700, then $55,250 low |
| ETH | Around $1,721 | $1,650–$1,700; $1,600 | $1,725–$1,750; $1,800–$1,850 | $1,650–$1,750 consolidation | $1,800–$1,850 if $1,750 clears | $1,600; potentially $1,540–$1,550 |
| XRP | Around $0.9259 | $0.91–$0.92; $0.88–$0.86 | $0.936–$0.94; $0.97–$1.00 | $0.91–$0.94 range | $0.97–$1.00 after $0.94 holds | $0.88–$0.86 if $0.91 fails |
Final Assessment
The digital-asset market begins the new week with a recovery that is measurable but not yet independently confirmed by the most important traditional-market demand channels. Bitcoin’s climb back above $60,000 after Reuters documented a $55,251.60 weekend trough is substantial. Ethereum’s stronger daily percentage move is also observable, while XRP has not shared equally in the rebound. None of these readings should be confused with an established change in the wider trend: all three remained negative over seven days in the latest synchronized CoinGecko observations.
The first analytical priority is to distinguish the elimination of forced selling from a renewal of discretionary investment. Liquidations and weaker derivatives open interest can make room for a sharp relief bounce. They can also leave markets more vulnerable to the next large order if liquidity providers have reduced inventories and risk limits. Follow-through should therefore be judged by sustained spot bids, the ability to trade through identifiable resistance bands and the behavior of funding and open interest, not merely by the size of the rebound from an extreme low.
The second priority is data completeness. The last fully populated Farside sessions, November 19, show $582.3 million of bitcoin ETF net withdrawals and $131.2 million of ether ETF withdrawals. The November 20 rows have missing issuer values and are not definitive totals. XRP product-flow snapshots are also not sufficiently aligned across issuer universes to support one final aggregate. These limitations are editorially material. Incomplete figures should neither be represented as zeros nor used to announce the end of institutional selling.
The third priority is the macro timetable. The November 23 flash purchasing managers’ readings, November 24 consumer-confidence report and November 25 growth and personal-income data can alter expectations for inflation, real yields and the dollar. U.S. Thanksgiving on November 26, followed by shortened Friday equity trading, means fewer conventional-market sessions in which institutions can hedge and rebalance. That configuration can produce abrupt crypto moves even when the initiating information appears routine. New releases are pending at this edition’s cutoff, and no outcome is assumed.
For bitcoin, the tactical question is whether $58,700–$60,000 remains defended while $61,450–$62,000 is challenged; the more ambitious recovery test sits nearer $64,000–$65,000. For ether, the corresponding challenge is to turn $1,650–$1,750 consolidation into a move toward $1,800–$1,850 without renewed large fund withdrawals. For XRP, $0.91–$0.94 remains the critical immediate range, with $0.97–$1.00 contingent on verified demand. Failure at those first supports would return attention to the more vulnerable lower scenarios in the forecast table.
The defining question for the coming sessions is therefore not whether the market has already found a permanent floor. It is whether the sources of selling that characterized last week—portfolio deleveraging, ETF redemptions and uncertainty over the cost of capital—are actually diminishing. A cash-market confirmation could give the weekend rebound a stronger foundation. Renewed institutional withdrawals or another correlated equity selloff could challenge it quickly. Until the evidence changes, an analytical distinction between observed recovery, incomplete financial data and conditional forward scenarios remains the most defensible account of the market.