Main Points:
- Expanding order-book liquidity both above and below spot prices suggests an imminent directional move.
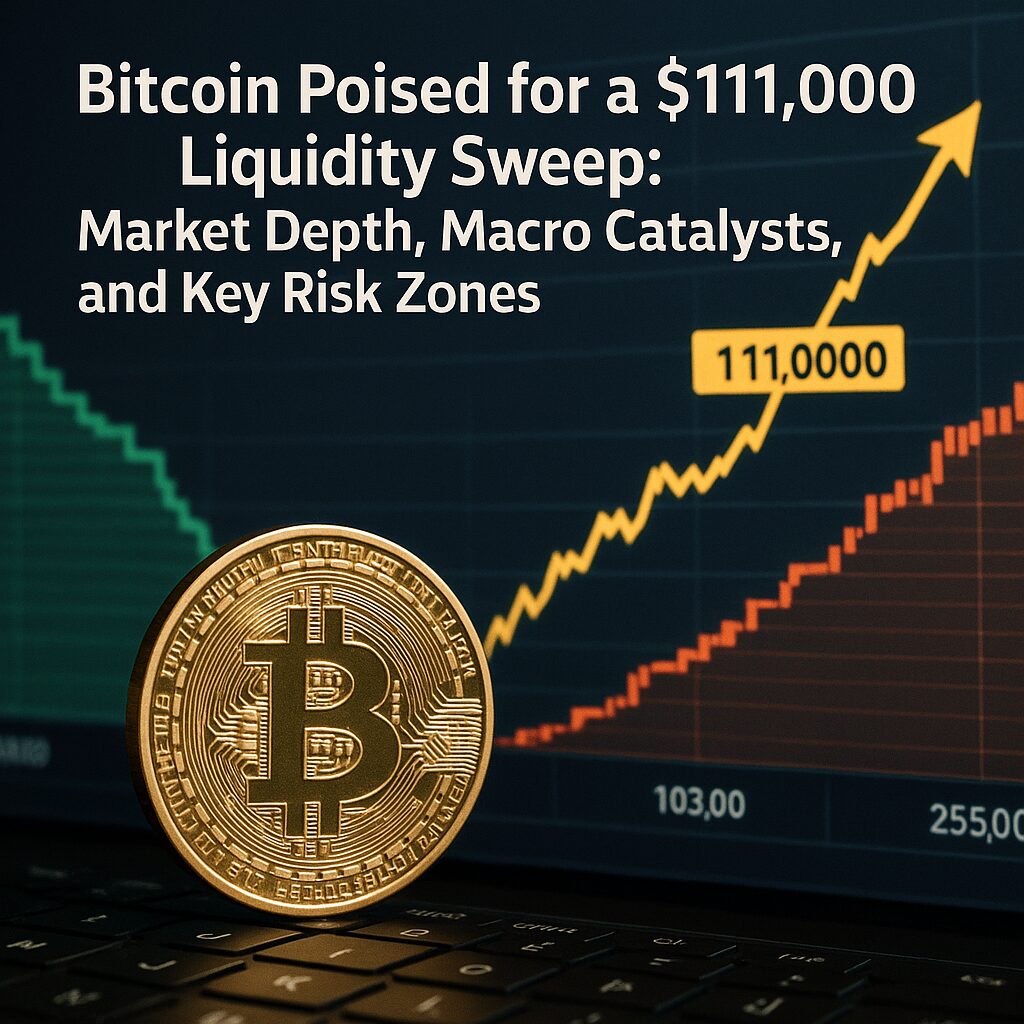
- Analysts expect BTC/USD to “sweep” liquidity at $111,000 before any sustained breakout or pullback.
- Downside liquidity clusters near $103,000 could trigger a sharp snapback if sellers dominate.
- The Core PCE deflator release on June 27, 2025 may catalyze volatility ahead of month-end positioning.
- A close above $102,400 on the monthly candle would confirm a bullish range breakout, while failure could reinforce consolidation.
1. Liquidity Landscape Shaping Price Action
Bitcoin has carved out a narrow trading range between roughly $105,000 and $108,000, with both longs and shorts accumulating around key levels. As highlighted by CoinGlass’ 24-hour liquidation heatmap, liquidity zones have become denser at price points both above and below spot (bright yellow bands in the chart). Such “liquidity walls” often precede sharp moves as the market hunts stops and liquidations to fuel momentum.
Traders Mark Cullen and “Jelle” on X note that the balance has recently tilted slightly to the upside, increasing the probability of a sweep higher toward liquidity around $111,000 . Conversely, should selling pressure intensify, the lower liquidity cluster near $103,000 may act as a magnet for price to retrace before any renewed upward thrust.
2. Upward Liquidity Target: $111,000
The next logical target on the upside is $111,000, a level that corresponds with a significant build-up of stop orders and margin positions. Historically, Bitcoin has flashed its strongest breakouts after “clearing” similar liquidity concentrations, as traders’ stops fuel accelerating momentum in the breakout direction.
- Why $111,000 matters: It aligns with the recent all-time high zone and represents the next concentration of forced-liquidation risk.
- Trader psychology: Clearing that zone would shake out bearish stops, often triggering a wave of fresh buying as momentum traders jump in.
- Practical takeaway: Position sizing should account for potential whipsaws near this level; consider staggered entries or protective stops just beyond the liquidity wall.
3. Downside Risks and Key Support at $103,000
On the flip side, the $103,000 level has emerged as the critical downside liquidity hub. Should BTC fail to overcome resistance above, a rapid pullback to harvest bids and stops in this area could ensue.
- Liquidity clustering: Concentration of long-side stops and hedges sits in the $105k–$104k range, with deeper bids around $103k.
- Market positioning: With many participants hedged neutrally, a sudden move into this zone could trigger a cascade of liquidations, exacerbating the decline.
- Risk management: Traders aiming for an upside breakout should trail stops below $104,000 to protect against a swift drop into this lower zone.
4. Macro Catalysts: Core PCE and Month-End Close
Beyond on-chain liquidity, macroeconomic data are poised to jolt markets. On Friday, June 27, 2025, the U.S. Bureau of Economic Analysis will publish the Core PCE price index, the Federal Reserve’s preferred inflation gauge. Expectations point to a 0.1% month-over-month rise and a 2.6% year-over-year increase. Any surprise acceleration could dampen risk appetite, while a softer print might embolden crypto bulls anticipating Fed rate cuts.
Additionally, month-end positioning ahead of the close on June 30 could amplify moves as institutions square books. A monthly close above $102,400—noted by analyst Rekt Capital as the upper boundary of the June range—would signal a bullish breakout; failure could extend consolidation into July.
5. Practical Implications for Crypto Investors
For readers seeking new crypto assets or yield opportunities, here’s how to apply these insights:
- Watch liquidity zones: Use tools like CoinGlass’ heatmap to identify where large‐scale liquidations reside. Enter or exit positions just outside these zones to avoid slippage and sharp adverse moves .
- Plan for macro events: Keep an eye on Fed-watch calendars. Volatility spikes around data releases can unlock fleeting arbitrage and yield strategies in DeFi platforms.
- Hedge strategically: Consider options or perpetual futures to hedge directional exposure if Bitcoin trades near $103k or $111k. Deribit markets are currently pricing a small chance of Bitcoin hitting $300,000 by June 27, 2025—an extreme scenario with roughly 9% odds.
- Diversify tactical trades: Explore altcoins with strong fundamentals as potential out-of-the‐money plays during consolidation phases. Liquidity hunts often rotate through mid-cap assets before broad market moves.
Conclusion
Bitcoin’s current range and heated liquidity clusters around $103,000 and $111,000 set the stage for a decisive move in either direction. Traders should remain vigilant of the upcoming Core PCE release on June 27 and month-end flows that could trigger outsized volatility. By mapping liquidity walls and aligning risk management with macro catalysts, investors can better position for the next leg of Bitcoin’s journey—whether that’s harvesting momentum above its all-time high or navigating a swift pullback into supportive liquidity zones.
