
Main Points:
- RSI Breakout on the Horizon: Bitcoin (BTC) is trading around $85,000, approaching a major Relative Strength Index (RSI) breakout—the first significant signal in six months.
- Market Resilience: Despite a 1.5% intraday gain and supportive RSI data on daily and weekly charts, Bitcoin’s current price zone is seen as a crucial inflection point for the next medium-term trend.
- Analyst Insights: Prominent traders and analysts, including Daan Crypto Trades and Matthew Hyland, indicate that a bullish divergence on weekly charts—expected for the first time since last September—could signal the resumption of a long-term uptrend.
- Local Bottom Indications: The Stockmoney Lizards team suggests a short-term bottom around $76,000, reinforcing the view that current adjustments are merely healthy corrections within a sustained bullish market.
- Outlook: Although a recovery may take time, the consensus is that this correction reinforces, rather than negates, the prevailing upward trend.
1. Market Update and RSI Signals
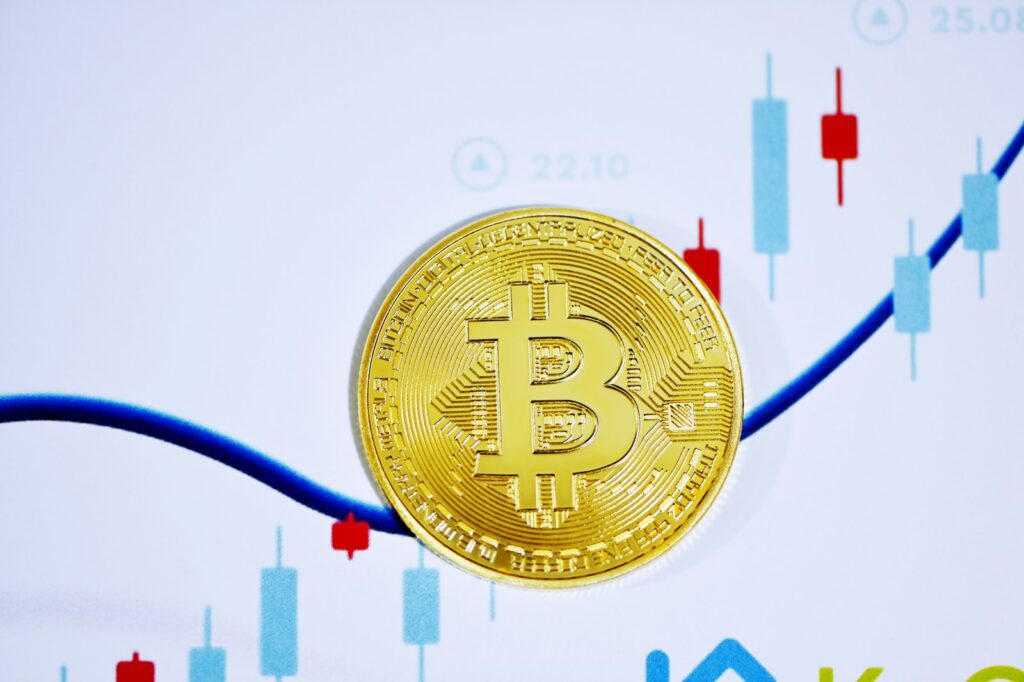
During the weekend of March 23, Bitcoin was observed trading near $85,000. Data from Cointelegraph Markets Pro and TradingView shows that BTC/USD maintained steady performance, rising 1.5% during daytime trading. This uptick, coupled with similar gains in major altcoins, has fueled expectations of an impending trend reversal.
Popular trader Daan Crypto Trades commented on X, noting that the coming week could be pivotal for determining the medium-term direction of the market. In particular, he highlighted the importance of the CME Group’s Bitcoin futures closing price as a key indicator.
2. Analysis of RSI Trends
Analyst Rekt Capital has drawn attention to a promising breakout in the daily RSI. According to his observations, Bitcoin’s daily RSI is beginning to retest support levels established during the prolonged downtrend that began in November 2024. This signal is viewed as an early indication that the market may soon pivot towards renewed bullishness.
Furthermore, analyst Matthew Hyland emphasized that Bitcoin’s weekly chart is set to display a bullish RSI divergence—the first such occurrence since September of last year, or roughly six months ago. Hyland believes that the current price zone is critical in determining whether the bullish momentum will continue.
3. Short-Term Support and Long-Term Trends
The trading team Stockmoney Lizards provided further context by analyzing a local bottom for Bitcoin at around $76,000. Their chart analysis shows that, despite some investors calling for a bear market, the long-term bullish trend channel remains intact. They argue that the current correction is not a sign of a trend reversal but rather a temporary adjustment that reinforces the overall upward trajectory of Bitcoin’s price.
While the recovery process may take time, their analysis supports the view that the current price adjustment is part of a healthy bull market, rather than a precursor to a prolonged downturn.
4. Conclusion and Future Outlook
In summary, Bitcoin’s trading around $85,000 and the emerging RSI signals on both daily and weekly charts suggest that the cryptocurrency is on the verge of a significant breakout. Despite the current correction, which has seen short-term trading levels as low as $76,000, the long-term trend remains bullish. Analysts and traders alike are optimistic that, once this key RSI breakout occurs, Bitcoin could resume its upward momentum—potentially setting the stage for a renewed bull market in the coming weeks.
Investors should remain cautious and monitor key technical indicators, as the timing of the recovery might be gradual. Nonetheless, the prevailing sentiment is that this adjustment reinforces Bitcoin’s enduring strength in a market that continues to defy broader economic uncertainties.
