Market Overview
Cryptocurrency markets entered Monday, 16 November 2026, with a fragile rebound rather than a confirmed change in trend. The latest CoinGecko snapshots retrieved for the Asian morning session placed bitcoin around $65,175, ether near $1,825 and XRP near $0.9687. The corresponding 24-hour changes were approximately +2.4%, +4.6% and +8.0%, but the same observations showed losses of 11.9%, 14.0% and 16.3% over seven days. Those two time frames describe markedly different realities. The immediate recovery reflects buying after forced selling and a weekend liquidity shock; the weekly readings still represent substantial capital impairment. The quoted prices are reference snapshots, not executable bids, and may move materially between research, publication and a reader’s visit. CoinGecko reported bitcoin’s 24-hour range at $62,080.91–$65,980.28, ether’s at $1,713.65–$1,840.70 and XRP’s at $0.8942–$0.9784. Market participants should distinguish a price bounce from sustained demand above prior support.
The weekend’s decisive development was a liquidation-driven slide through major technical levels. A Bloomberg dispatch distributed by Moneycontrol described about $1.9 billion of crypto liquidations in the 24 hours through 7 a.m. Sunday in Singapore, including roughly $684 million in bitcoin contracts and $466 million in ether contracts. Long positions accounted for most of that reported damage. The figure is a particular historical observation window, not a live or Monday liquidation tally; platforms, exchange coverage and cutoffs can produce different totals. The same report traced the squeeze to bitcoin’s break below its roughly $73,000 200-day moving average, diminished risk appetite and renewed selling pressure. On its own, an exceptionally large liquidation event can exhaust weak positions and enable a rebound. It does not demonstrate that new leveraged demand has returned, especially when spot buyers have not yet rebuilt the structure lost during the decline.
Institutional fund flows offer the clearest counterweight to a purely technical recovery story. Farside Investors recorded a completed net $185.4 million withdrawal from US spot bitcoin ETFs on Friday, 13 November, including $143.5 million from BlackRock’s IBIT and $41.9 million from Fidelity’s FBTC. The 9–13 November daily totals add to roughly $1.065 billion of outflows. In contrast, the corresponding ether ETF table shows a small $2.3 million net inflow on Friday, composed of $11.6 million into FETH and $9.3 million out of Grayscale’s ETH product, against nearly $399 million of net withdrawals over the full week. These are confirmed trading-session observations; Monday’s US market session has not occurred at the Asian morning cutoff. ETF flows measure changes in the fund structure rather than the full distribution of all spot purchases and sales, and they cannot establish the motives of individual investors.
The macroeconomic setting is unusually restrictive for a speculative asset trying to stabilize. The US Bureau of Labor Statistics reported that October consumer prices rose 0.4% month on month, versus 0.6% in September, while core prices continued to increase. A slower monthly pace was not enough to remove inflation concerns or the prospect of more monetary tightening. US Treasury data for Friday, 13 November, showed the two-year yield near 4.88%, the ten-year around 5.15% and the thirty-year about 5.47%. As yields rise, investors earn more on dollar-denominated instruments and often demand greater expected returns for assets without contractual cash flow. Reuters reported on 13 November that Boston Fed President Susan Collins regarded additional increases as likely. Her view is guidance, not a completed rate decision.
Risk sentiment was already near an extreme. Alternative.me’s Crypto Fear & Greed Index was reported at 10, classified as extreme fear, on 15 November, down from 13 on 14 November. CoinGecko’s separate on-page sentiment display showed 21 when checked, demonstrating why a named source and date matter more than an unqualified claim about ‘the fear index.’ A score based on volatility, momentum and other inputs should not be interpreted as a probability of a rebound. Outside crypto, disrupted Middle Eastern shipping and energy infrastructure remained an additional source of potential inflation volatility, while technology-equity weakness complicated the broader appetite for long-duration assets. The immediate analytical question is whether liquid spot markets, completed fund disclosures and a steadier Treasury curve can reinforce the rebound once US desks reopen, or whether the movement merely resets leverage for another test of the weekend lows.
Bitcoin Market Analysis
BTC Narrative
Bitcoin’s first task is to convert mechanical relief into durable ownership. The largest asset recovered to roughly $65,175 after a CoinGecko intraday low just over $62,080, a swing exceeding $3,000, yet its seven-day decline remained close to 12%. The price action reveals both the depth of forced selling and the existence of bids beneath the market; it does not establish how long those bids will persist when derivatives activity normalizes. The weekend is especially revealing because liquidity can thin outside the principal US ETF trading hours. Liquidation engines close positions as collateral thresholds are breached, often creating market orders into already weak books. Once enough leveraged positions are closed, buying against the overshoot can produce an impressive percentage move with no corresponding shift in the medium-term macro backdrop. A sustainable turn would need more than a single Sunday low: it would include repeated defense of support during heavier weekday volume and reduced sensitivity to marginal rate headlines.
The latest completed spot ETF session indicates that traditional fund demand has not yet provided that reinforcement. Friday’s $185.4 million withdrawal followed a $284.1 million net exit on Thursday, according to Farside’s issuer-level table. Across the five sessions from 9 to 13 November, the recorded aggregates were approximately negative $201.0 million, $95.0 million, $299.8 million, $284.1 million and $185.4 million. The resulting $1.065 billion weekly withdrawal is materially more informative than assigning special significance to one daily figure. On Friday, the recorded negative entries were concentrated in IBIT and FBTC rather than evenly distributed across funds. That concentration could reflect a change in the vehicles preferred by some investors, portfolio hedging or redemptions, but the public flow table does not identify causes. Nor should published zero entries be treated as evidence that secondary-market ETF turnover or underlying coin trading disappeared. ETF share trading, primary-market creations and redemptions, and direct bitcoin transactions represent different forms of activity.
The macro trigger remains the repricing of US policy rather than a new bitcoin-specific rule. October CPI’s 0.4% increase, firmer Fed communications and a near-5.15% ten-year Treasury yield leave bitcoin competing with increasingly attractive nominal and real yields. That competition is most uncomfortable after a leveraged decline, because investors deciding whether to add exposure can delay without the opportunity cost associated with a rapidly rising market. The dollar, equity volatility and longer-dated real yields therefore belong on the same monitoring screen as on-chain activity. In a separate risk channel, reports of a major exchange-security incident have weighed on confidence in trading infrastructure; the impact should be analyzed as a possible liquidity and counterparty-confidence shock, not an assertion that bitcoin’s underlying consensus mechanism failed. Further confirmed institutional buying would help distinguish the wider asset from isolated operational risks, but such confirmation cannot be assumed ahead of the next US fund-flow publication.
BTC Technical & Liquidity Structure
Bitcoin’s immediate structure now spans several distinct zones. The most defensible near-term support reference is the observed $62,080–$62,500 neighborhood, which brackets the latest CoinGecko low and the area where aggressive selling recently met demand. Below that, $60,000 is a psychological round number, not a verified resting order or guaranteed buying floor. First resistance lies around $65,980–$66,000, the upper edge of the quoted 24-hour range. Beyond that, $68,000–$70,000 encompasses the market’s recent breakdown and former round-number support, where trapped holders might seek liquidity. The previously cited 200-day trend area around $73,000 becomes a more distant recovery objective rather than today’s immediate trigger. The support and resistance references are conditional chart zones drawn from observable trading ranges and recent market structure, not forecasts with statistical confidence levels or proof of unfilled limit orders.
CoinGecko’s research snapshot indicated approximately $42.4 billion of 24-hour BTC trading volume and about $1.31 trillion of market capitalization. Its separate perpetual-futures panel displayed roughly $39.1 billion of open interest and an eight-hour funding-rate indication near +0.0024%. Those futures metrics are venue-aggregated estimates from the data vendor, subject to changes in coverage and update timing. Open interest is a stock of outstanding contracts, not the number of dollars that traded today; volume is a flow over time; funding is a periodic transfer intended to align perpetual prices with spot. Even a modestly positive funding reading after large long liquidations cannot establish a one-sided market. What matters is the trajectory: a rally accompanied by rising spot turnover and comparatively measured funding would look healthier than a rally dominated by rapidly expanding perpetual exposure. Conversely, open interest rising while price stalls beneath $66,000 would warrant scrutiny for a crowded, vulnerable position.
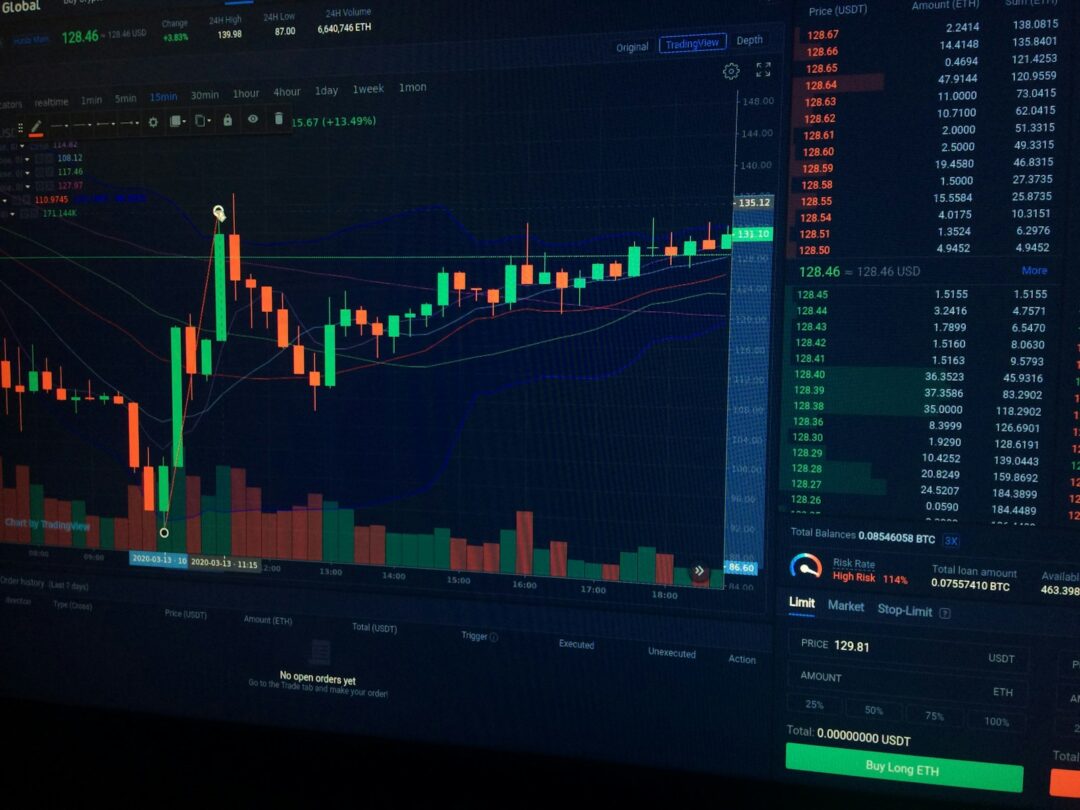
Liquidity also varies by venue and order-book depth. A global daily volume figure should not be mistaken for immediately available bids at a particular price, particularly after a large cascade. Large liquidations can generate high turnover while reducing the amount of capital resting near the midprice. The test of recovery is whether slippage, spreads and market depth improve as volume returns, not simply whether candle ranges narrow for a few hours. Participants watching TradingView should assess the four-hour closes relative to $62,500 and $66,000, and then compare them with exchange-specific spot prints. A reclaim of $66,000 without follow-through through $68,000 may be no more than a trading-range move. A failure back below the recovered mid-$60,000 area would return attention to the original liquidation low. Any projection beyond that low has much less empirical support and should be explicitly treated as scenario planning.
BTC Forecast
The base case for the next several sessions is consolidation with elevated two-way volatility between roughly $62,500 and $68,000. The argument is not that the market has discovered fair value, but that a pronounced deleveraging event often produces a pause while natural buyers and sellers re-establish prices. Confirmation would come from higher lows above the weekend trough, comparatively stable perpetual funding and a reduction in the pace of confirmed ETF redemptions. Under this case, the current price can rise or fall several thousand dollars without invalidating the broader diagnosis. Friday’s fund flow remains negative, so a narrow rally before Monday’s US session should be considered provisional. A mixed US opening, in which equities are stable but yields keep rising, would leave spot buyers facing a difficult backdrop and could sustain choppy, low-conviction trading.
The upside case requires evidence, not merely a green daily candle. A sustained break above $66,000, followed by acceptance around $68,000 and then recovery toward $70,000, would indicate that the market is absorbing liquidation supply rather than simply bouncing into it. At the same time, stabilization in the two- and ten-year Treasury yields and at least a moderation of US bitcoin ETF withdrawals would improve the quality of the advance. A later move toward the roughly $73,000 longer-term trend area would become plausible only after the nearer resistance zones had been reclaimed. A forceful price move driven mostly by fresh leverage, with funding rapidly becoming more expensive and no improvement in cash demand, would be an inferior upside signal. There is no defensible numerical probability for these cases from the available public data.
The downside case starts with repeated inability to hold the mid-$60,000s, followed by a four-hour or daily failure through the observed $62,080–$62,500 support area. A renewed rise in bond yields, further institutional outflows or a sudden deterioration in market-making depth could trigger that path. Below the weekend low, attention would shift to the $60,000 psychological boundary and then to historically traded lower areas only after fresh price evidence established them. The relevant distinction is between an orderly support test and a liquidation cascade: the latter usually features a fast increase in forced position closures, weak bids and volatility that outpaces spot-depth recovery. The forecast is therefore a set of observable conditions rather than a promise that a certain level will trade. The market’s direction should be judged against completed rather than preliminary US-session data.
Ethereum Market Analysis
ETH Narrative
Ethereum’s rebound carries a different burden from bitcoin’s. The latest CoinGecko reference near $1,825 was approximately 4.6% higher over 24 hours, but still 14.0% below the comparable level a week earlier. The 24-hour price range ran from about $1,714 to $1,841, including another sharp downside excursion before buyers returned. Ether is both a widely held speculative asset and the principal settlement asset for a network used by decentralized exchanges, stablecoins and other blockchain applications. Consequently, the investment thesis includes activity on the network and demand for settlement services, but those longer-term features do not insulate the token from short-term deleveraging. During portfolio stress, managers may sell liquid ETH exposure to raise dollars regardless of whether Ethereum transaction activity remains functional. The important question is whether investors distinguish operational network utility from changes in the price of the asset needed to use or secure that network.
Fund disclosures offer a narrow positive point within a difficult trend. Farside’s completed Friday table recorded a $2.3 million aggregate inflow for US spot ether ETFs, reversing several negative sessions. Fidelity’s FETH received about $11.6 million, partly offset by a $9.3 million withdrawal from Grayscale’s ETH trust. The total is too small to justify a claim that institutions have decisively returned. For the whole week of 9–13 November, the daily reported aggregates sum to about $398.9 million of net outflows. In other words, Friday’s small plus softened the trajectory but did not erase the underlying pattern. ETF flows are also affected by the fund choices and allocations of institutional investors, and readers should not conflate them with net ETH issuance, staking deposits or changes in DeFi total value locked. Each provides a different answer to the question of whether the ecosystem is attracting durable capital.
Ethereum’s macro sensitivity can be more pronounced during periods of shrinking leverage because its valuation combines network-use expectations with exposure to broader venture and technology-risk cycles. Higher real yields challenge assets whose expected benefits arrive in an uncertain future, while falling crypto collateral values can force lenders and market makers to reduce balance-sheet capacity. A price recovery in ETH can therefore lag a stabilization in BTC even when Ethereum’s technical platform performs normally. It is also important to avoid projecting announcements about tokenization, stablecoin adoption or scaling directly into a precise ETH price effect. Such developments may support long-term transaction demand, but fee economics, layer-two activity, token issuance and institutional ownership patterns determine how much value accrues to the asset. In the current market, the more immediate signals are the cost of derivatives leverage, completed ETF flows and whether ether can retake the price levels surrendered during the selloff.
ETH Technical & Liquidity Structure
The reference structure for ETH is anchored by the $1,713–$1,740 demand area visible in the latest 24-hour range and the weekend’s lower trading. The nearby resistance marker is approximately $1,840–$1,850, at the upper edge of the current range; $1,900 then represents a secondary recovery zone, with $2,000 the more significant psychological level lost during the previous decline. These bands are chart landmarks rather than precise estimates of trading inventory. A market that holds above $1,740 while closing repeatedly above $1,850 would suggest at least partial stabilization. Failure to hold the lower band would open the possibility of a renewed liquidity search, although it would be premature to assign a precise lower price target without corroborating volume and order-book data. Price history should be checked against the current chart rather than treated as immutable resistance once the market moves.
CoinGecko showed approximately $15.7 billion in 24-hour ETH trading volume, a market capitalization near $223 billion and around $23.1 billion in perpetual-futures open interest at the research cutoff. Its aggregated eight-hour funding indication was modestly positive, around +0.0018%. The ratio between perpetual exposure and spot-market capitalization is not the same as an investor’s leverage ratio, but it highlights the scale of derivative risk surrounding the asset. The relevant watchpoints are whether open interest contracts further as weak holders exit, whether it expands as prices rise, and whether expanding exposure is supported by real purchases. A rally through $1,850 accompanied by a large jump in positive funding and little spot confirmation could become fragile quickly. By contrast, improving bid depth and modest leverage expansion would be more consistent with a repair of the market’s microstructure.
Ethereum’s market also spans spot exchanges, centralized perpetual contracts and decentralized trading systems. Liquidity in one venue cannot automatically meet liabilities in another because collateral assets, settlement schedules and liquidation mechanisms differ. During a rapid ETH selloff, hedges and on-chain collateral can move at different speeds, increasing execution and basis risks. The user-visible TradingView widget supplies a live four-hour chart, but its historical candles and current price can change after the editorial snapshot. The article’s levels should therefore be interpreted as the analyst’s structure at the stated cutoff, not as a live instruction to act on stale quotes. In practical market terms, a close above $1,850 would be an initial test of buyers’ confidence; only subsequent acceptance around $1,900 and progress toward $2,000 would materially improve the short-term structure. Repeated rejection below $1,850 would leave the market vulnerable to another test of the $1,700s.
ETH Forecast
The ETH base case is a volatile, incomplete stabilization process broadly within $1,740–$1,900. A market emerging from severe long-liquidation pressure often spends time re-establishing collateral buffers and rebuilding price discovery. Here, a one-day improvement in ETF flows is encouraging only in the narrow sense that the latest daily total was not negative; the weekly aggregate still reflects capital leaving the category. For the base case to hold, ETH should defend the $1,740 zone, avoid a sharp deterioration in perpetual funding and begin to trade on genuine spot interest during US and European sessions. The market can achieve those conditions without a rapid recovery to $2,000. A prolonged range may be healthier than another leveraged spike, particularly if yields remain high and the broader dollar funding environment is restrictive.
The upside case would emerge through sustained four-hour acceptance above $1,850, progress through $1,900 and an eventual challenge of $2,000. It would become more persuasive if US spot ETH fund flows stabilized over several completed sessions, spot turnover recovered and aggregate funding remained contained. The main catalyst could be a softer shift in the US rates outlook or improving technology-market sentiment, but those must be observed rather than anticipated as certainties. Because ether’s valuation is sensitive both to macro rates and to expectations for blockchain usage, a recovery in network activity might improve narrative support while remaining insufficient to overcome a broad withdrawal from risky assets. A breakout that fails quickly and returns below $1,850 would not meet the conditions for the upside scenario.
The downside case is a failure below $1,740 and especially a decisive loss of the roughly $1,713 intraday trough, accompanied by new negative fund-flow data or renewed derivatives stress. In that circumstance the risk is not necessarily a linear decline toward a fixed number: thin order books and liquidations can produce discontinuous trades and deep wicks. The psychological $1,700 area becomes the first zone to watch, but no lower guaranteed floor can be justified from the available snapshot. Analysts should monitor whether ETH underperforms BTC on relative-return and ETH/BTC measures; persistent relative weakness would suggest sector-specific risk aversion beyond the general crypto drawdown. Improving relative strength, in contrast, might offer an early sign that demand for higher-beta assets is recovering. Neither signal replaces confirmation from completed market and fund data.
XRP Market Analysis
XRP Narrative
XRP delivered the strongest reported 24-hour rebound among the three assets, approximately 8.0% to about $0.9687, following a 24-hour trough near $0.8942. That apparent strength must be measured against a 16.3% seven-day loss and a price still below the psychologically important $1 threshold. A high percentage gain from a depressed starting point is compatible with a continuing downtrend. XRP has a distinct investment narrative linked to cross-border settlement, XRP Ledger infrastructure, exchange liquidity and dedicated US investment products. Yet the weekend selling occurred alongside weakness in BTC and ETH, so it would be misleading to classify every price movement as a reaction to an XRP-specific regulatory development. Relative strength needs to persist beyond one volatile daily bar before it can support a conclusion that the asset is decoupling from broader crypto risk.
The XRP fund-flow picture is less standardized than the large bitcoin and ether ETF datasets and requires particular care. A 14 November tracker review citing SoSoValue and CoinGlass reported about $19.13 million of net withdrawals from its US spot XRP ETF coverage during the five trading sessions ending 13 November. It described a roughly $1.09 million negative Friday reading within that coverage, including an inflow into Franklin’s product and an offsetting withdrawal from Grayscale’s. A separate issuer-holdings tracker treated 13 November as incomplete pending a Franklin issuer file, despite identifying 12 November as its last fully reconciled day. Those different coverage definitions mean the analyst cannot present one number as a universally reconciled total for every US XRP fund. The defensible conclusion is that tracked flows weakened during the week, with complete-universe comparability dependent on the tracker.
This distinction matters because dollar assets under management can fall sharply when the token price drops even if the number of XRP held by products remains comparatively steady. Fund outflow calculations, market-value changes and secondary-market share turnover are separate measurements. A decline in fund assets therefore cannot by itself show how many coins were redeemed or transferred. The question for investors is whether dedicated investment-product demand becomes a persistent marginal buyer when XRP regains the $1 area, or whether that channel is simply too small to offset an across-the-board reduction in speculative positioning. Regulatory developments affecting exchanges, payment companies or token classification may be important over longer horizons, but no fresh final regulatory approval or court ruling is established by the present source set. Today’s editorial emphasis is accordingly on verified capital flows, the price structure and the funding market rather than manufacturing a new legal catalyst.
XRP Technical & Liquidity Structure
XRP’s recovery begins from a particularly compressed price map. CoinGecko’s observed 24-hour low was about $0.8942 and the high around $0.9784. The initial support zone is therefore approximately $0.895–$0.915, with $0.94 as an intermediate area where buyers may need to defend the rebound. Immediate resistance rests around $0.978–$1.00. A sustainable move through $1 would be analytically more meaningful than a temporary intraday print above that level because many market participants organize risk and headlines around round numbers. Beyond $1, an initial supply zone around $1.05–$1.10 is a conditional recovery target inferred from the previous breakdown, not a verified limit-order wall. A move below $0.895 would invalidate the immediate recovery pattern and invite a reassessment of lower liquidity zones using fresh exchange data. These are deliberately broad bands to reflect volatility and the absence of a guaranteed common best price across venues.
At the research cutoff, CoinGecko displayed approximately $2.50 billion of 24-hour XRP turnover, around $61.5 billion of market capitalization and $2.07 billion of perpetual-futures open interest. The displayed aggregated eight-hour funding rate was slightly negative, near -0.0014%, contrasting with the modestly positive BTC and ETH indications. A negative funding rate commonly means shorts pay longs in the corresponding perpetual structure, but it does not automatically mean the market is net short across every venue or that a short squeeze is imminent. Funding is both venue- and time-dependent, and spreads between the perpetual and spot market can change during sharp rallies. If XRP pushes toward $1 while funding stays contained and spot activity improves, the advance may be supported by real buying rather than an unstable squeeze. If funding flips sharply positive and open interest expands faster than cash-market participation, the apparent momentum could become vulnerable again.
Execution risks are especially relevant near a round-number boundary. Market makers can widen spreads or reduce displayed size during large price moves, while traders with collateral in correlated assets may suffer simultaneous margin pressure. The observed $0.8942 low is a historical print, not evidence that an identical bid will exist on the next decline. Likewise, resistance at $1 is behavioral rather than a single immutable order-book level. Four-hour closes, the ratio of XRP to BTC, and the ability to hold above $0.94 following any attempt at $1 together provide a more useful assessment than isolated candlestick wicks. A second consideration is fund coverage: a change in product flow should be compared with the precise reporting universe and date, particularly when one issuer’s file is missing. This discipline prevents false confidence arising from combining inconsistent datasets.
XRP Forecast
The XRP base case is a wide consolidation between roughly $0.90 and $1.00 while the wider crypto market digests the liquidation episode. Within this range, a rally toward the upper boundary would not in itself signal a restored medium-term uptrend. Confirmation would require repeated higher lows above $0.915, acceptance above $0.94 following pullbacks and funding that remains consistent with improving rather than overheating leverage conditions. Further evidence would come from stabilized BTC prices, better spot XRP depth and newly completed fund-flow reports on a consistent universe. Because XRP has already fallen steeply over the week, the distinction between recovery and trend is particularly important. Investors should neither extrapolate an 8% daily gain indefinitely nor assume that every short-lived pullback signals a new bearish breakdown.
The upside case is a clean recovery above $0.978 and $1.00, followed by price acceptance that converts the round-number boundary into support. If that occurs while cash-market turnover improves and the completed XRP-fund reporting set shifts away from redemptions, the market could test $1.05–$1.10. A simultaneous broad recovery in BTC and ETH would strengthen the case; an XRP-only spike on thin volume would make it weaker. Positive regulatory or infrastructure news might eventually provide independent support, but only a verified event should be incorporated into the current catalyst list. The relative-strength measure should also improve beyond the daily rebound: a sustained narrowing of XRP’s seven-day underperformance against bitcoin would indicate that recent volatility is no longer merely mechanical. There is no reliable public basis here for a numerical likelihood or guaranteed time to recovery.
The downside case is a loss of $0.94 followed by a sustained break below roughly $0.895. Under that sequence, the market would have failed to preserve both the rebound’s intermediate price and its weekend low. The next lower area would require fresh chart evidence; assigning a precise fixed price target below the observed low would create more apparent accuracy than the available sources support. The more important risk variables are persistent US real-yield pressure, weak performance in BTC, new forced selling, and incomplete or negative fund-flow readings. If these combine, XRP’s higher volatility could amplify wider crypto losses. If they ease, a period of sideways consolidation might provide the foundation for a later recovery. The scenarios are explicitly conditional and should be updated with verified new data rather than previous-week assumptions.
Key Levels and Forecast Table
| Asset | Current Area | Key Support | Key Resistance | Base Case | Upside Scenario | Downside Scenario |
|---|---|---|---|---|---|---|
| BTC | About $65,175 | $62,080–$62,500 | $65,980–$66,000; $68,000–$70,000 | Consolidation around $62,500–$68,000 | Hold above $66,000; recover $68,000 and then $70,000 | Lose $62,080–$62,500; reassess toward $60,000 |
| ETH | About $1,825 | $1,713–$1,740 | $1,840–$1,850; $1,900; $2,000 | Range around $1,740–$1,900 | Accept above $1,850 and $1,900; challenge $2,000 | Break $1,713–$1,740; test the $1,700 area |
| XRP | About $0.9687 | $0.895–$0.915; $0.94 intermediate | $0.978–$1.00; $1.05–$1.10 | Range around $0.90–$1.00 | Reclaim and hold $1.00; test $1.05–$1.10 | Lose $0.94 then $0.895; reassess lower liquidity |
Final Assessment
The defining question for Monday is whether the recovery of spot prices is strong enough to withstand the return of the US ETF and Treasury markets. Bitcoin around $65,175, ether around $1,825 and XRP around $0.969 are materially above the weekend’s lowest prints, yet all three still carry double-digit losses over the preceding week. The large liquidation figures reported during the Sunday Asian session show how quickly leveraged risk can become compulsory market selling. They also explain why price rebounds after a cascade can be unusually abrupt. None of these facts, individually or together, proves that a durable bottom has formed. Confirmed fund flows and the next risk-session reaction provide a better test than the size of one intraday candle.
Institutional evidence remains mixed but predominantly cautious. Farside’s completed Friday bitcoin ETF aggregate was negative $185.4 million and its weekly tally was approximately negative $1.065 billion. Ether recorded a marginal positive $2.3 million Friday result after nearly $399 million left over the week. XRP-focused tracking suggested approximately $19 million of weekly redemptions within one quoted reporting universe, while a separate issuer-file methodology still lacked a complete Friday set. These observations must not be blended into a fictitious comprehensive cross-asset flow total. Each fund family has different products, reporting coverage and trading behaviors. In particular, the absence of a published issuer cell is not zero, and Monday’s US ETF session has not taken place as of the Asian morning research cutoff.
Macro constraints remain visible. October’s US CPI report, hawkish Fed language and the 13 November Treasury curve together indicate that higher-for-longer financing conditions are a meaningful near-term risk. The next scheduled US economic releases and Federal Reserve appearances, including November manufacturing and the following day’s retail-sales data, may alter that assessment; scheduled releases are not completed events. Oil and geopolitical volatility could further affect inflation expectations, while weakness in technology shares may still spill into leveraged crypto positioning. In each case, the causal link should be treated as a market hypothesis tested against prices and flows, rather than inferred automatically from simultaneous headlines.
For bitcoin the operational thresholds are defense of $62,080–$62,500 and recovery through $66,000, then $68,000. For ether, preservation of the $1,713–$1,740 area must precede sustained progress beyond $1,850 and $1,900. For XRP, support around $0.895–$0.915 and a credible reclaim of $1 are the relevant near-term markers. Across all three, the higher-quality signal would combine improved cash-market depth, restrained funding, stabilizing fund disclosures and a less hostile rates environment. A move driven only by rapid re-leveraging would leave the market exposed to another cascade. Until those confirming conditions appear, the appropriate description is a fragile post-liquidation rebound inside a still-damaged trend, not a completed return to risk appetite.