
Main Points :
- If Bitcoin decisively breaks below $74,508, the long-term uptrend structure weakens, opening the door to a potential decline toward $50,000.
- A sustained recovery above $100,000 would likely restore bullish momentum and re-open the path toward the previous all-time high of $126,199, with further upside scenarios extending beyond.
- While traditional four-year Bitcoin cycles have historically guided market expectations, regulatory shifts, spot Bitcoin ETFs, and institutional adoption may be structurally altering these dynamics.
- Long-term monthly charts still indicate a higher-high, higher-low trend, but weekly indicators warn that Bitcoin is approaching a decisive fork between continuation and prolonged consolidation.
Introduction: Bitcoin at a Crossroads Entering 2026
Bitcoin has entered 2026 at one of the most consequential moments in its history. After beginning 2025 near $93,000, plunging to approximately $74,500 in April, and then surging to a record $126,199 in October, the market has since retraced a substantial portion of those gains. This sharp sequence of volatility has reignited a long-standing debate: has Bitcoin already completed its cycle peak, or is the market merely pausing before its next structural advance?
Opinions among analysts remain deeply divided. Some argue that Bitcoin has already formed a macro top and is transitioning into a prolonged bearish or sideways market, reminiscent of 2018 or 2022. Others counter that downside risk is limited, citing strong institutional demand, favorable regulation, and ETF-driven capital inflows as forces that could push Bitcoin to new highs in 2026.
Accurately predicting Bitcoin’s future is inherently difficult. However, long-term charts—particularly monthly and weekly timeframes—offer a disciplined way to evaluate probable scenarios rather than rely on speculation. This article examines those charts in detail, integrates recent structural developments, and assesses what they collectively imply for Bitcoin’s trajectory in 2026.
Long-Term Structure: What the Monthly Chart Still Tells Us
On a monthly timeframe, Bitcoin continues to exhibit a pattern of higher highs and higher lows, a textbook definition of a sustained uptrend. Despite recent volatility, this structural characteristic has not yet been invalidated.
[BTC/USDT Monthly Chart – Long-Term Trend Structure]
A key feature of the monthly chart is the 20-month exponential moving average (EMA), currently positioned around $88,049. During the previous two major corrections, this moving average acted as a reliable support zone, attracting long-term buyers and marking the resumption of the broader uptrend.
If Bitcoin remains above this 20-month EMA, the argument that the long-term bull trend is intact remains technically valid. However, a monthly close below both the 20-month EMA and the April low of $74,508 would represent a structural breakdown. Such a move would disrupt the higher-low sequence and suggest that demand is weakening, with buyers unwilling to step in except at significantly lower prices.
Under that scenario, the chart implies a potential decline toward the $50,000 region—an area that aligns with prior consolidation zones and psychological support. This would not necessarily signal the end of Bitcoin as an asset, but it would likely delay any new all-time highs and usher in a prolonged period of consolidation.
The Bullish Alternative: Reclaiming Six Figures
Conversely, the bullish scenario remains compelling if Bitcoin can defend key supports and reclaim higher levels. A strong rebound from the 20-week or 20-month EMA, followed by a decisive move above the psychological $100,000 threshold, would reinforce the notion that the recent pullback was corrective rather than terminal.
Once above $100,000, market psychology tends to shift rapidly. Momentum traders, systematic funds, and retail participants often re-enter aggressively, creating conditions for a renewed push toward the $126,199 all-time high. This level is expected to attract heavy selling pressure from profit-takers and bearish participants alike.
If bulls manage to absorb that supply and break higher, the chart projects potential extensions toward approximately $141,188, and in more aggressive scenarios, as high as $178,621. While such targets may appear ambitious, they are mathematically consistent with previous breakout structures observed in Bitcoin’s history.
Short-Term Warning Signs: Insights from the Weekly Chart
While the monthly chart remains constructive, the weekly timeframe introduces a note of caution. Moving averages on the weekly chart are approaching a bearish dead cross, a configuration not seen since early 2022.
[BTC/USDT Weekly Chart – Moving Averages and Risk Zones]
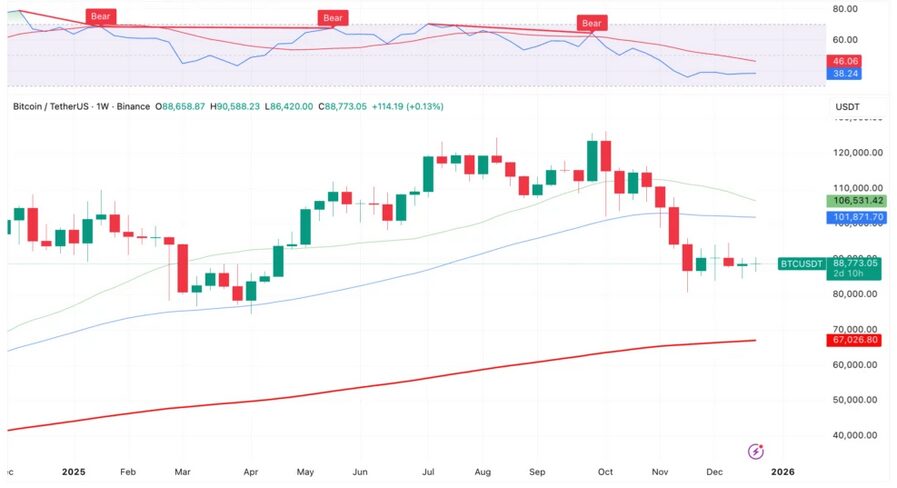
The last time such a crossover occurred, Bitcoin entered a prolonged downtrend. Although history never repeats perfectly, it often rhymes. A decline toward $74,508 appears plausible in the near term, and this level is expected to attract defensive buying.
However, sentiment plays a critical role. In bearish environments, rebounds are frequently sold into rather than celebrated. In 2022, Bitcoin repeatedly failed at moving-average resistance before resuming its decline. A similar pattern in 2026 would increase the probability of a breakdown below $74,508.
Repeated tests of support tend to weaken it. A confirmed weekly close below this level would complete a bearish head-and-shoulders pattern, significantly increasing the likelihood of a drop toward $50,000. Such a move could be followed by months of sideways trading, delaying the next sustainable uptrend.
Are Bitcoin’s Four-Year Cycles Losing Relevance?
One of the most debated questions in the current market is whether Bitcoin’s traditional four-year cycle—historically tied to halving events—still holds predictive power. Many analysts argue that structural changes have fundamentally altered Bitcoin’s behavior.
The launch of spot Bitcoin ETFs, increased participation by pension funds and asset managers, and a more favorable regulatory climate in major jurisdictions have introduced persistent demand that did not exist in earlier cycles. These forces may be smoothing volatility and extending cycles rather than compressing them.
That said, human psychology, leverage, and speculative excess have not disappeared. Even in a more institutionalized market, price still moves in waves of optimism and fear. Rather than disappearing entirely, the four-year cycle may be evolving into a less rigid, more complex pattern.
Institutional Demand and the Macro Backdrop
Beyond charts, Bitcoin’s 2026 outlook is deeply intertwined with macroeconomic forces. Expectations of easing monetary policy, concerns about sovereign debt, and ongoing currency debasement narratives continue to position Bitcoin as a strategic alternative asset.
ETF flows have introduced a new baseline of demand, while corporate treasury allocations—though still limited—add credibility to Bitcoin’s role as digital collateral and long-term reserve asset. These factors collectively reduce the probability of a deep, multi-year bear market comparable to earlier cycles.
Conclusion: A Defining Year Ahead
Bitcoin enters 2026 at a genuine inflection point. Long-term charts still support the bullish thesis, but short-term signals warn that complacency is dangerous. The $74,508 level represents a line between structural resilience and deeper correction, while $100,000 remains the gateway to renewed upside.
Rather than asking whether Bitcoin will simply rise or fall, investors and practitioners should focus on which scenario the market confirms. In an era of institutional participation and regulatory maturation, Bitcoin’s next major move is likely to be both technically and structurally significant.
