Main Points :
- Bitcoin is consolidating just below the $98,000–$100,000 resistance zone after reclaiming prior highs.
- Cooling U.S. inflation data triggered a short squeeze, reinforcing a technical bottoming pattern.
- On-chain indicators show stabilization rather than distribution, supporting the consolidation thesis.
- Rising U.S. bond yields remain a headwind, making upcoming macro data critical.
- January 22 U.S. GDP and PCE data could act as a decisive catalyst for Bitcoin’s next trend.
1. Market Overview: Bitcoin at Elevated Levels, Waiting for Direction
Bitcoin has entered a phase of high-level consolidation after a strong rebound earlier this month. As of mid-January, BTC is trading near $98,000, having successfully reclaimed the December highs that previously acted as resistance.
The week began with choppy price action around $93,000–$95,000, reflecting uncertainty among traders. However, sentiment shifted decisively following the release of U.S. Consumer Price Index (CPI) data for December. The CPI reading showed year-over-year inflation unchanged from November, while the month-over-month increase slowed—easing fears of renewed inflation acceleration.
This macro development triggered a sharp move higher in Bitcoin, pushing prices above $96,000 and forcing short sellers to cover positions. The resulting short squeeze carried BTC close to $100,000, reinforcing the perception that a local bottom had been formed.
From a broader perspective, Bitcoin’s current behavior suggests neither aggressive risk-on speculation nor meaningful risk-off distribution. Instead, the market appears to be waiting for confirmation from macroeconomic signals—particularly from the United States.
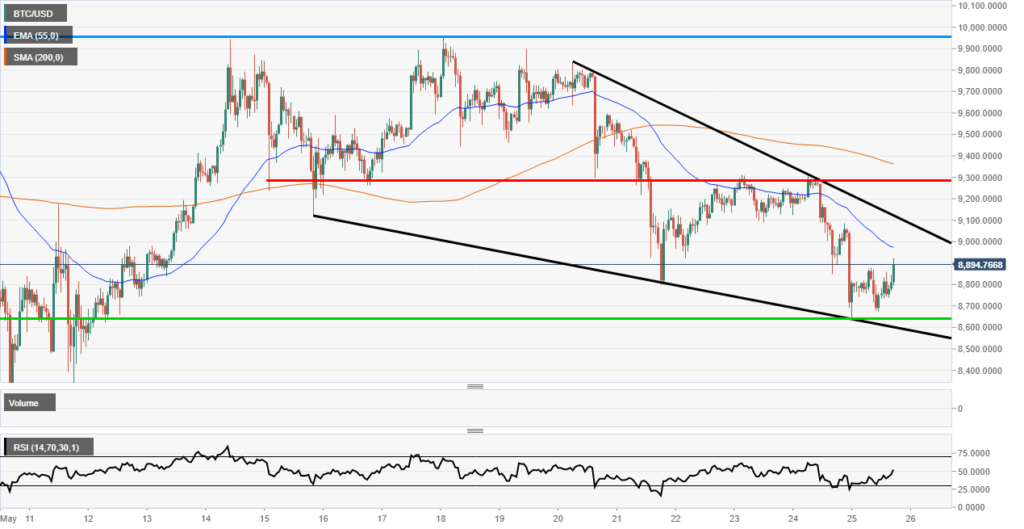
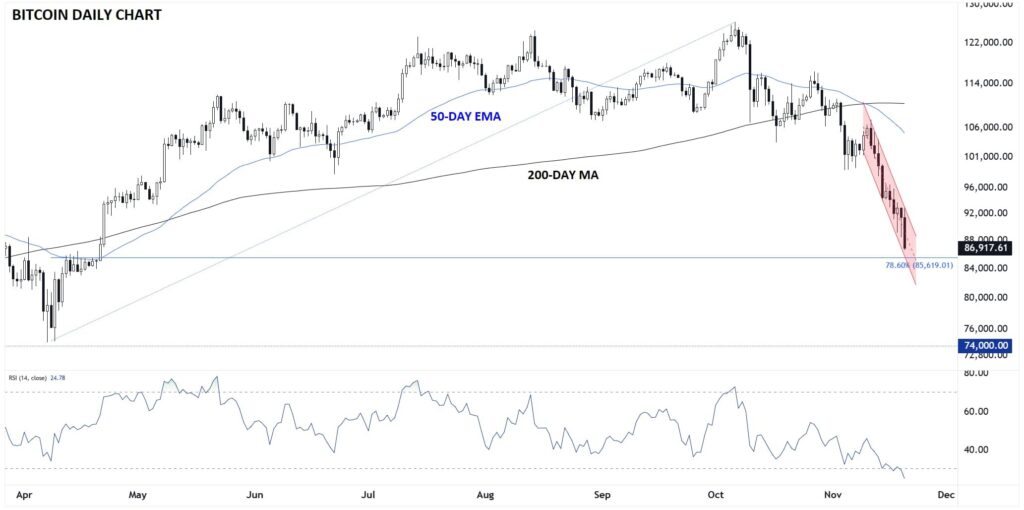
2. Technical Structure: Saucer Bottom Breakout and Key Resistance
From a technical standpoint, Bitcoin’s recent rally completed what many analysts describe as a saucer bottom formation in the USD-denominated chart. This pattern, characterized by a rounded base and gradual recovery, is often interpreted as a sign of accumulation and trend reversal.
The breakout above the saucer’s “platform” significantly increased confidence that Bitcoin had exited its corrective phase. However, price is now encountering a dense resistance cluster between $97,000 and $98,000, where multiple technical levels converge:
- The 100-day moving average
- The 38.2% Fibonacci retracement from the all-time high to the November low
- Psychological resistance just below the $100,000 mark
This convergence makes the area particularly difficult to break without a strong external catalyst.
Notably, despite the recent pullback from highs, Bitcoin has held above former resistance levels, which now act as support. This behavior aligns with healthy consolidation rather than exhaustion.
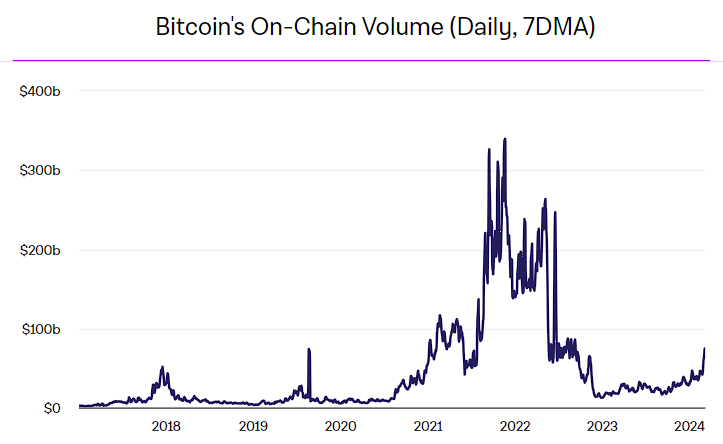
3. On-Chain Data: Signs of Stability, Not Distribution
On-chain metrics provide further context to Bitcoin’s current range-bound behavior. Data on transaction counts, active addresses, and mining pool flows suggest stabilization rather than large-scale profit-taking.
Monthly transaction volumes remain steady, indicating consistent network usage rather than speculative spikes. Similarly, active address counts show neither a sharp decline nor euphoric expansion—often a hallmark of overheated markets.
Flows from mining pools to exchanges have also remained moderate. Historically, significant increases in miner-to-exchange transfers precede sell pressure, but current levels do not indicate urgent liquidation.
Taken together, these on-chain signals support the view that Bitcoin is digesting recent gains, rather than entering a distribution phase.
4. Macro Crosscurrents: Inflation Relief vs. Rising Yields
While easing inflation fears provided a tailwind, not all macro indicators are supportive. Recent U.S. labor market data showed lower-than-expected jobless claims, reinforcing the narrative of a resilient economy.
As a result, U.S. Treasury yields have risen, tightening financial conditions and tempering enthusiasm for risk assets. Higher yields increase the opportunity cost of holding non-yielding assets such as Bitcoin, making sustained upside moves more challenging without additional catalysts.
Equity markets add another layer of complexity. U.S. tech stocks briefly weakened midweek but found support following strong earnings from major semiconductor firms. The Nasdaq index is once again approaching record highs, and a confirmed breakout could reignite risk appetite across markets—including crypto.
5. The January 22 Catalyst: Why GDP and PCE Matter
The focal point for markets is January 22, when the United States releases:
- Final Q3 GDP growth figures
- Personal Consumption Expenditures (PCE) price data for October and November
The PCE deflator, in particular, is closely watched by the Federal Reserve as its preferred inflation gauge. A softer-than-expected reading would strengthen expectations for monetary easing later in the year—potentially unlocking further upside for Bitcoin.
Conversely, strong growth combined with sticky inflation could reinforce the “higher for longer” narrative, increasing resistance near $100,000 and extending the consolidation phase.
Until then, Bitcoin is likely to continue oscillating near current levels, with traders reluctant to commit heavily in either direction.
6. Practical Implications for Crypto Investors and Builders
For investors searching for new crypto assets or yield opportunities, Bitcoin’s current phase offers important lessons:
- Breakouts near cycle highs often require macro confirmation, not just technical setups.
- On-chain stability favors structured accumulation strategies over momentum chasing.
- Correlation with equities remains relevant; monitoring Nasdaq behavior is essential.
For builders and institutions exploring blockchain use cases, Bitcoin’s resilience reinforces its role as a macro-sensitive digital asset, increasingly integrated into global financial narratives rather than operating in isolation.
7. Conclusion: Consolidation Before the Next Decision Point
Bitcoin’s price action near $98,000 reflects a market at equilibrium—supported by improving inflation data and constructive technical patterns, yet constrained by rising yields and macro uncertainty.
Rather than signaling weakness, this consolidation may represent preparation for the next directional move. The upcoming U.S. GDP and PCE releases on January 22 are likely to provide the clarity needed to resolve the current stalemate.
Whether Bitcoin breaks decisively above $100,000 or extends its range, the coming weeks will underscore its evolving role as a globally macro-linked asset—one that demands both technical and economic literacy from participants.
