Main Points :
- Bitcoin’s recent 26.7% correction is the largest of the current cycle — historically a late-stage flush.
- Multiple sentiment indicators, including the Fear & Greed Index, have fallen to “extreme fear,” which often precedes strong rebounds.
- On-chain data confirms deep short-term holder capitulation, a signal that usually forms cycle bottoms.
- Analysts argue that this environment aligns with historical high-reward accumulation zones.
Introduction: A Historic Correction That May Signal Opportunity
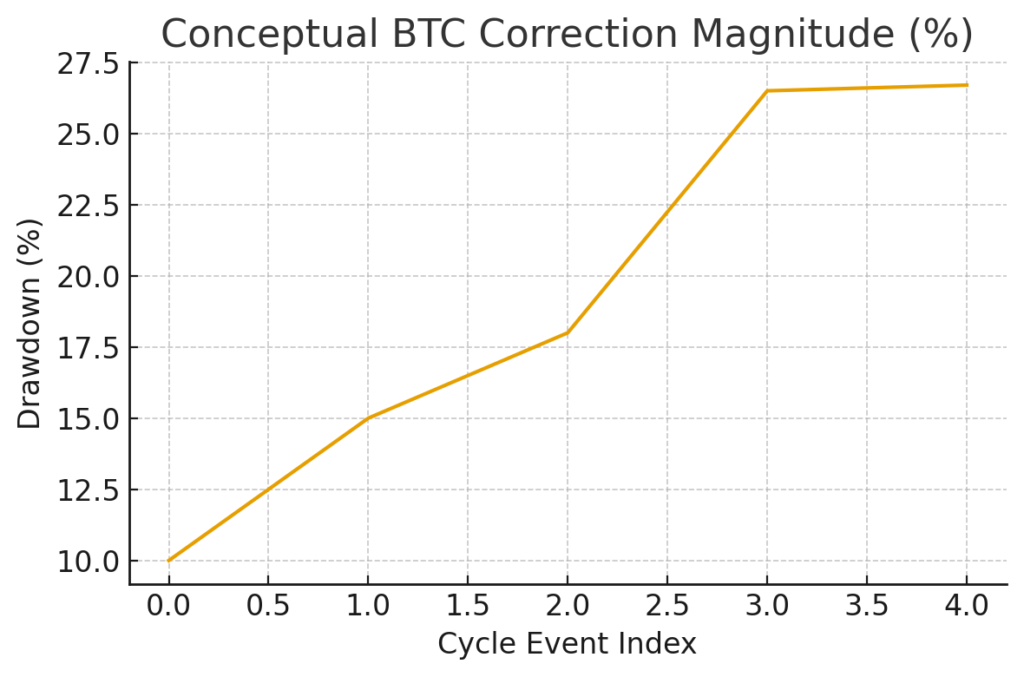
Bitcoin experienced a sharp 26.7% pullback this week — slightly surpassing the April drawdown of 26.5% and marking the largest correction in the current bull cycle. While steep declines often spark panic, the underlying data suggests something different: this drop resembles a classical late-stage flush, where leveraged positions unwind violently before a new leg upward begins.
Several market-structure indicators, sentiment metrics, and on-chain data points have reached levels typically associated with strong medium-term buying opportunities, not cycle tops. Analysts across the industry now argue that Bitcoin at $90,000 represents a “close-your-eyes-and-buy” zone — the kind of moment visible only in hindsight for many investors.
To understand why, we break down the data across three pillars: market structure, sentiment dynamics, and on-chain capitulation signals. We then connect this event to broader global macro trends influencing crypto markets in 2025.
1. Market Structure Signals Reach Extremes, but Not Collapse Levels
1.1 The Largest Correction of the Cycle
Bitcoin’s 26.7% drawdown pushed several structural indicators into historically significant zones. According to Axel Adler Jr., the local market stress index remained elevated at 67.82 — above the structural WATCH threshold of 64, yet below levels seen during systemic collapses such as 2020 or 2022.
This suggests the market is under pressure, but not breaking.
During the sharpest moment of the decline:
- Realized volatility surged with a Z-score of 4.55,
- Liquidations spiked across futures markets,
- Order-book liquidity thinned rapidly, amplifying downward momentum.
Still, the system showed signs consistent with forced deleveraging rather than failure. This distinction matters: structural collapses take months to repair, while deleveraging flushes often precede fast recoveries.
1.2 Stress Levels Begin to Normalize
Over the past 24 hours, stress readings fluctuated between 62 and 68. Although the short-term slope shows increasing internal stress, such volatility is typical during bottom-forming periods, when markets violently test support zones before reversing.
This backdrop explains why analysts do not interpret the correction as the end of the cycle. Instead, they see conditions resembling other deep but constructive shakeouts.
2. Sentiment Indicators Enter “Extreme Fear” — Which Historically Leads to Gains
2.1 Fear & Greed Index Drops Below 10
The Fear & Greed Index briefly fell below 10 before recovering to 15 — still well within “extreme fear” territory.
Historically, Bitcoin rarely stays in this zone for long. Data from multiple cycles shows:
- Bitcoin gains 10% on average within 7 days
- Gains remain strong for 15–30 days
- +23% average after 80 days
- +33% average after 180 days
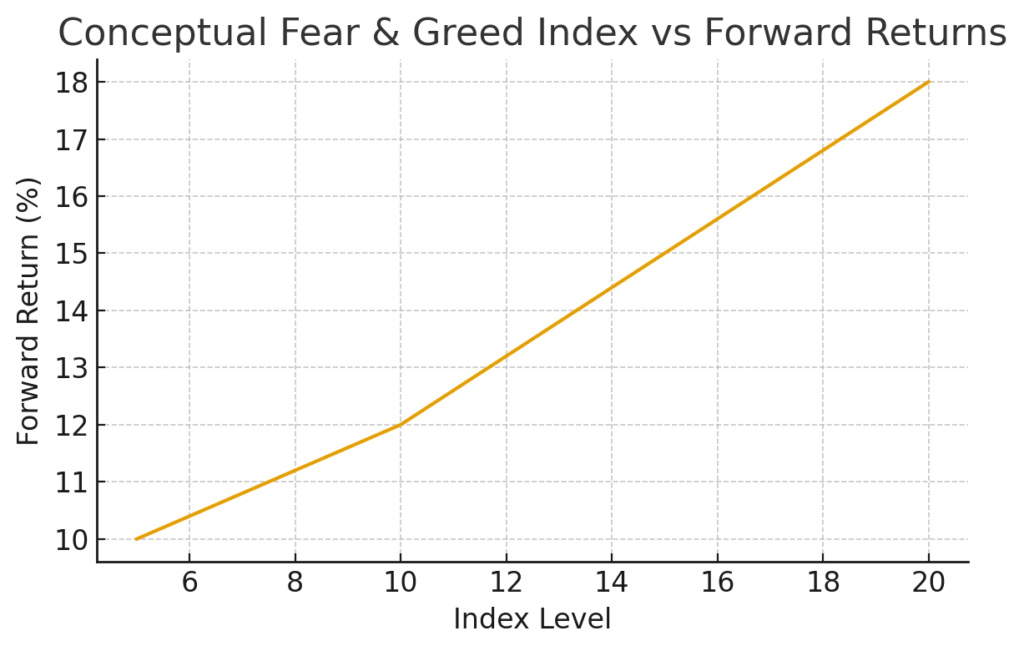
In other words, extreme fear has been a contrarian bullish signal, not a bearish one.
2.2 Capitulation Patterns Show Move Toward Reversal
Economist Alex Krüger notes that in 11 capitulation events since 2018, almost all were followed by rebounds, even when short-term weakness persisted.
Fear peaks correspond to accumulation opportunities, not distribution phases.
2.3 Analysts Call This a “Close-Your-Eyes-and-Buy” Zone
Bitcoin analyst VICTOR argues that current pricing sits inside a historically recognizable late-cycle accumulation band — not the euphoric top.
He describes the zone as one where long-term investors “close their eyes and buy” because:
- Sentiment is excessively pessimistic
- On-chain data shows late-stage capitulation
- Price has returned to historically strong value ranges
This aligns with classic market psychology: tops form on euphoria; bottoms form on fear.
We are clearly in the latter.
3. On-Chain Signals Confirm Deep Capitulation Among Short-Term Holders
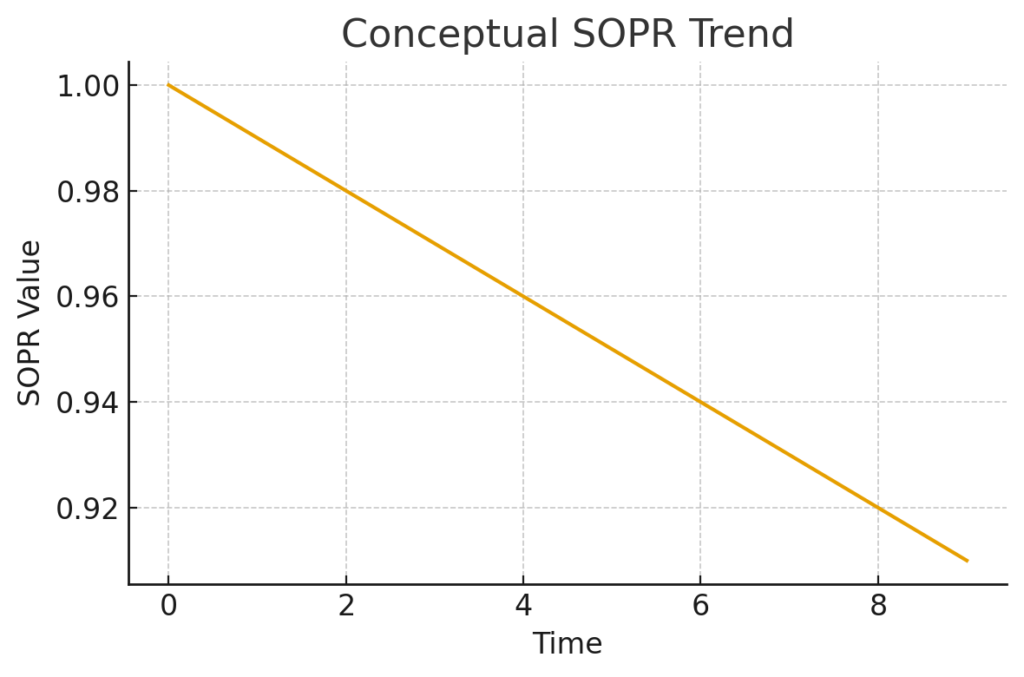
3.1 SOPR Falls to 0.97 — Meaning STHs Are Selling at a Loss
Short-Term Holder SOPR (Spent Output Profit Ratio) has dropped to 0.97, indicating consistent loss-taking among recent buyers.
SOPR below 1.0 for multiple weeks historically appears near cycle reversals.
3.2 STH-MVRV Drops Deep Below 1.0
This means:
- Almost every recent buyer is underwater
- Unrealized losses are widespread
- Fear among STHs is peaking
Such conditions match previous “final flush” periods.
3.3 Exchanges See 65,200 BTC Flow In at a Loss
This is not theoretical fear — it is real panic selling.
Loss-making inflows to exchanges tend to occur:
- at late-stage corrections
- during liquidation cascades
- before market reversals
While this does not guarantee an immediate bounce, the combination of SOPR < 1.0, deeply negative MVRV, and loss-based inflows is a classic hallmark of cycle bottom formation.
4. Context from Recent Global Market Trends
To provide broader relevance for investors seeking new opportunities or blockchain use cases, we integrate the latest macro dynamics:
4.1 Institutional Accumulation Is Still Rising
Large U.S. funds continue to expand BTC positions for:
- balance-sheet risk hedging
- long-term macro exposure
- digital asset diversification
Spot Bitcoin ETFs have seen net inflows for most weeks in Q4 2025.
4.2 Global Liquidity Cycles Are Turning
Recent rate expectations and early discussions of easing cycles in major economies have improved the investment environment for risk assets, including crypto.
Crypto behaves like a high-beta liquidity asset, benefiting from:
- lower real yields
- weaker dollar cycles
- expanding money supply
4.3 Token Rotation Is Accelerating
Investors are shifting toward:
- Layer-2 ecosystems
- Liquid staking assets
- Interoperability solutions
- Real-world asset tokenization platforms
Such environments historically favor altcoin seasons, emerging asset exploration, and new on-chain revenue opportunities — highly relevant for readers seeking new crypto assets or practical blockchain applications.
Conclusion: A High-Probability Accumulation Period for Strategic Investors
The convergence of market structure indicators, sentiment metrics, and on-chain capitulation signals suggests that Bitcoin’s recent decline is not the end of the cycle. Rather, it closely resembles prior late-stage flushes that historically preceded strong multi-month rallies.
For investors focused on:
- discovering new crypto opportunities
- capturing the next revenue wave
- deploying blockchain applications
this correction provides a high-reward setup—the type typically recognized only after the market has already rebounded.
As always, risk management and time horizons matter. But data across cycles aligns with one conclusion:
Extreme fear creates extreme value.
And Bitcoin at $90,000 increasingly looks like such a moment.
