Main Points :
- Bitcoin’s recent drop from $126,000 to $106,000 has formed a classic bullish descending wedge, historically a precursor to upward breakouts.
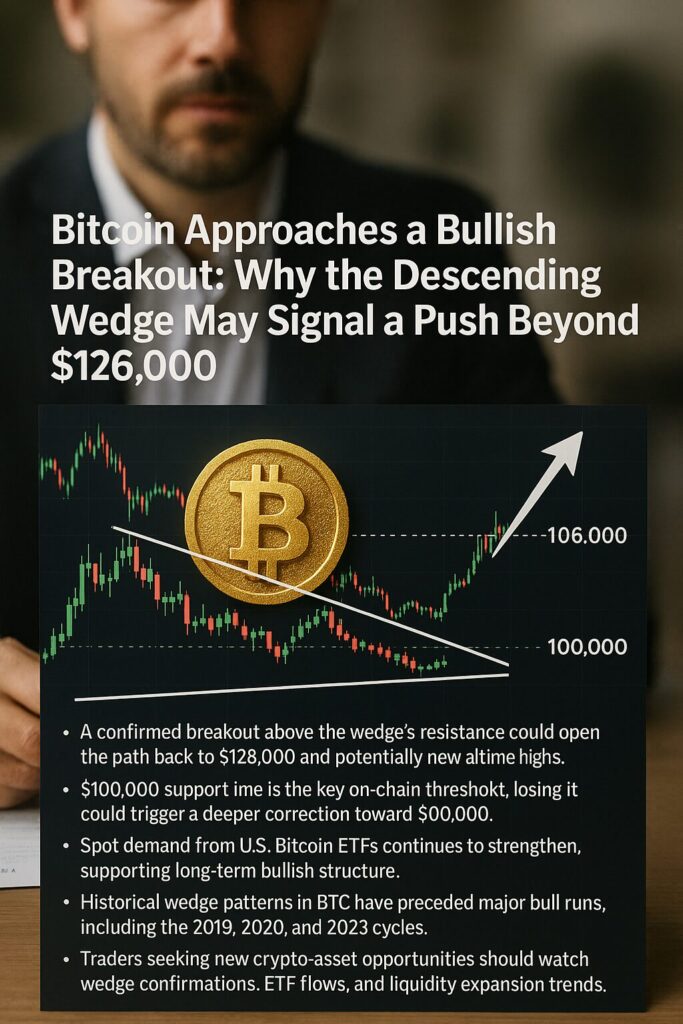
- A confirmed breakout above the wedge’s resistance could open the path back to $126,000 and potentially new all-time highs.
- The $100,000 support line is the key on-chain threshold; losing it could trigger a deeper correction toward $90,000.
- Spot demand from U.S. Bitcoin ETFs continues to strengthen, supporting long-term bullish structure.
- Historical wedge patterns in BTC have preceded major bull runs, including the 2019, 2020, and 2023 cycles.
- Traders seeking new crypto-asset opportunities should watch wedge confirmations, ETF flows, and liquidity expansion trends.
1. Introduction: A Market Preparing for Its Next Phase
Bitcoin’s recent price behavior has drawn global attention, not simply because of the sharp retracement from its $126,000 peak, but because of what the charts are now signaling. After declining to the $106,000 level, Bitcoin is forming a descending wedge, one of the most historically reliable bullish patterns in technical analysis.
For investors hunting for new digital assets, alternative income opportunities, or practical blockchain applications, understanding the structure of Bitcoin’s macro setup is essential. The flagship asset often dictates liquidity flows into mid-cap and early-stage tokens—including those emerging in OTC, DEX, and ecosystem-specific markets.
This article provides a detailed overview of Bitcoin’s chart structure, wedge mechanics, historical comparisons, ETF demand data, and macro-crypto factors influencing the next potential breakout—followed by a full Japanese translation.
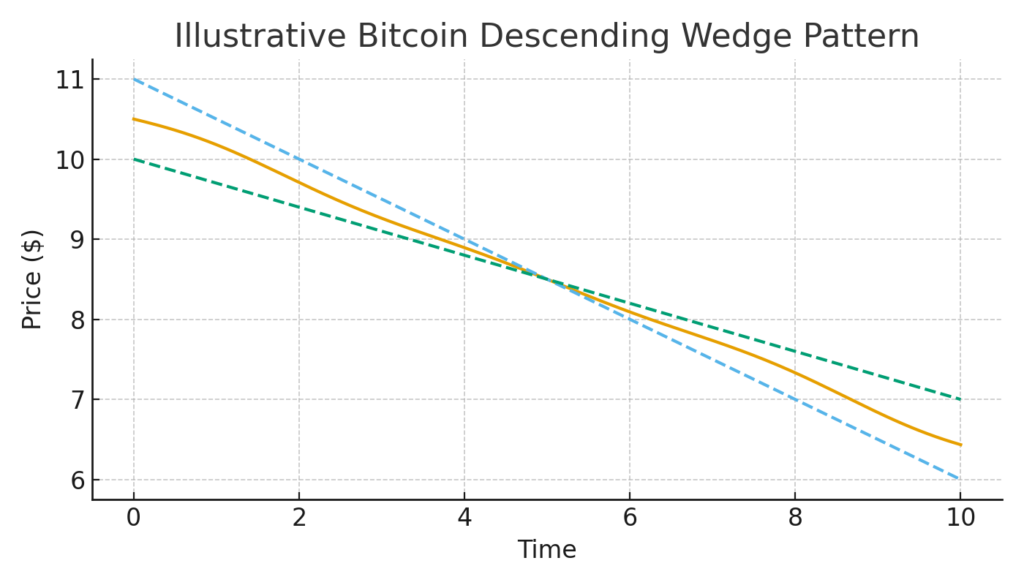
2. Chart Pattern: What the Descending Wedge Indicates
The descending wedge forms when both highs and lows contract downward, but the slope of lower highs is steeper than that of lower lows. This shows that selling pressure is weakening, even as price declines.
Key Technical Features
- Converging downward trendlines
- Gradual decline in volatility
- Slowing sell pressure
- Often precedes strong bullish breakouts
Bitcoin’s current wedge spans the recent high of $126,000 to the recent lows near $106,000. The resistance line currently sits around $106,000–$107,000, meaning a breakout above this range would serve as confirmation.
Insert Graph Here: Descending Wedge Illustration
3. What Happens if Bitcoin Breaks the Wedge?
If Bitcoin successfully breaks out above the wedge’s upper boundary, several bullish scenarios unfold:
3.1 Reclaiming $126,000
Once price breaks above the resistance band, the nearest major target is the previous all-time high at $126,000. Breakouts from wedges tend to move swiftly because traders close short positions and new buyers enter on momentum.
3.2 Extension to New Highs
Given liquidity from:
- U.S. spot Bitcoin ETFs
- Restored retail inflows
- Institutional automated accumulation models
…a breakout may push Bitcoin beyond current all-time highs and trigger expansion to new psychological levels.
Traders commonly track:
- $130,000
- $150,000
- $180,000 (projection zone from wedge expansion)
These levels become relevant if market conditions align.
4. ETF Demand and On-Chain Data Support the Bullish Case
Bitcoin’s market structure today is very different from earlier cycles—most notably because of spot ETF demand.
4.1 U.S. Bitcoin ETFs Have Become a Constant Buyer
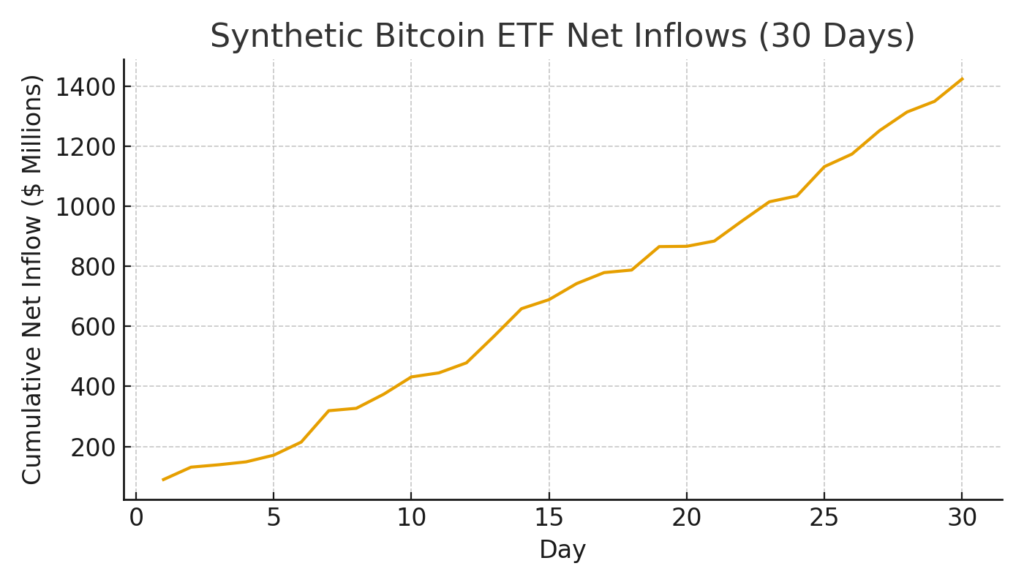
Even during corrections, ETF inflows remain positive. Data from early-Q4 2025 shows:
- Consistent daily net inflows
- Reduced volatility from ETF-driven liquidity
- Strong correlation between ETF demand and price recovery
This indicates that structural demand, not short-term speculation, continues to underpin Bitcoin’s long-term support.
4.2 On-Chain Support at $100,000
On-chain realized-price clusters show strong buyer activity around $100,000.
If Bitcoin stays above this level:
- Bullish structure remains intact
- Wedge pattern remains valid
- Market psychology remains supportive
If Bitcoin breaks below $100,000, price could visit:
- $95,000 (minor support)
- $90,000 (major support zone)
This would still not break the long-term bull trend, but would delay new highs.
5. Historical Perspective: When Bitcoin Formed Similar Wedges
Bitcoin has formed descending wedges before—and they often signal the beginning of major uptrends.
5.1 2019 Wedge → 2020–2021 Bull Run
Price consolidated around $6,000–$8,000 before exploding to $68,000.
5.2 2020 Pandemic Wedge
A sharp selloff formed a wedge, followed by a rally from $10,000 to $30,000.
5.3 2023 Post-Halving Wedge
Bitcoin consolidated at $25,000–$30,000 before rising above $60,000.
5.4 2025: Current Cycle
The structure resembles 2019 most closely—tight compression with strong macro demand.
6. Macro Conditions Supporting Bitcoin’s Next Move
Several broader economic and technological trends reinforce Bitcoin’s bullish potential.
6.1 Liquidity Expansion and Renewed Risk Appetite
Central banks in the U.S., EU, and Japan have slowed tightening cycles, leading to:
- Increased risk-asset allocation
- Higher liquidity across exchanges
- Rising venture capital activity
6.2 Institutional Adoption
Major banks and asset managers continue to:
- Offer Bitcoin custody
- Allocate client funds
- Integrate blockchain settlement rails
These flows typically accelerate after each breakout.
6.3 New Crypto-Asset Opportunities
A Bitcoin breakout usually leads to:
- Rotation into mid-caps
- Rotation into ecosystem tokens
- Search for early-stage utility tokens
This is directly relevant to readers exploring new asset opportunities.
7. Key Risks to Monitor
No bullish pattern is guaranteed. Traders must watch:
7.1 Wedge Breakdown
A breakdown invalidates the pattern and may cause an accelerated correction.
7.2 ETF Outflows
A sudden reversal in ETF demand could pressure spot markets.
7.3 Macro Shocks
Unexpected U.S. policy shifts, exchange failures, or regulatory crackdowns can disrupt momentum.
8. Conclusion
Bitcoin is at an inflection point.
The descending wedge pattern—combined with strong ETF demand, resilient on-chain support, and favorable macro conditions—suggests that the recent correction may be a preparation phase for renewed upward movement.
If the breakout occurs, Bitcoin could revisit $126,000 rapidly and potentially reach new all-time highs.
If support at $100,000 fails, a deeper correction is possible—but the long-term bullish structure appears intact.
For investors exploring new digital assets, revenue models, or blockchain applications, the next phase of Bitcoin’s movement will set the tone for the broader market in 2026 and beyond.
