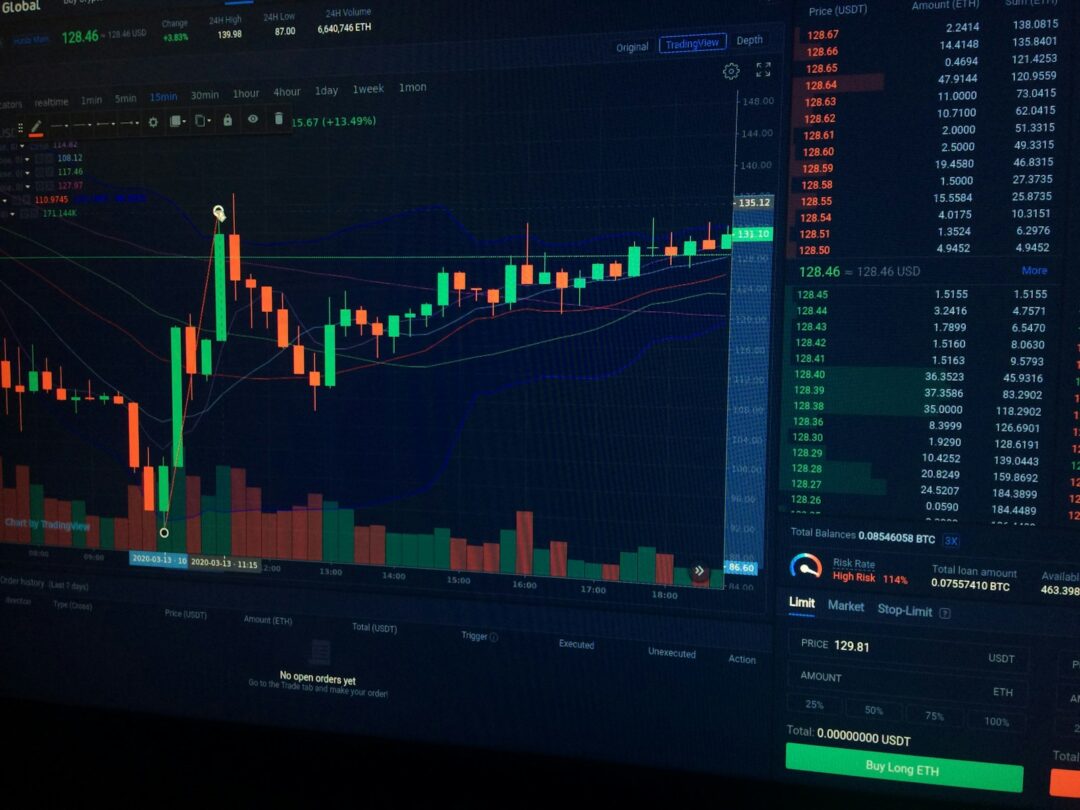
Market Overview
Digital assets entered Tuesday, November 17, 2026, in Asia with a superficially stable price tape but a less reassuring institutional backdrop. Bitcoin was near $65,000, ether around $1,800 and XRP below $1 after a weekend liquidation shock and a Monday session in which US equities suffered substantial technology-led losses. The central question has shifted from whether short sellers can be forced to cover to whether sustained cash buyers will appear once those mechanical rebounds have faded. A stronger dollar, uncertainty over the Federal Reserve’s December decision and unresolved fund-flow data make this an unusually difficult environment in which to equate stability with recovery.
For the early Tuesday Asian editorial cutoff, CoinMarketCap’s Bitcoin reference displayed approximately $65,177, with a market capitalization near $1.31 trillion and reported 24-hour turnover around $31.75 billion. Its corresponding ether and XRP pages showed about $1,823 and $0.9594, respectively, with estimated market capitalizations of $222.95 billion and $60.94 billion. These are moving reference quotes, not synchronized exchange settlement prices; observations can differ by several minutes from derivatives feeds and from daily calculations prepared in a different timezone.
The more decisive overnight development came outside crypto. Reuters reported that the S&P 500 declined 1.92% and the Nasdaq Composite 2.49% on Monday, November 16, as selling spread across artificial-intelligence and semiconductor shares. The semiconductor index lost approximately 5.3%. The magnitude matters because Bitcoin and ether increasingly sit within portfolios whose risk budgets are shaped by broader technology volatility, funding conditions and dollar liquidity. A cryptocurrency that holds steady while technology stocks fall may be showing resilience, but the inference remains tentative until fund flows and market depth confirm it.
This macro spillover has a distinctive character. The US dollar strengthened to levels not seen since April 2025, according to Reuters’ November 16 global-market report, while Treasury yields eased modestly during the equity selloff after rising during the previous week. Falling yields on a risk-off day therefore do not automatically signal easier monetary policy. Investors were still pricing the possibility of another Federal Reserve rate increase, creating a configuration in which lower bond yields can coexist with higher expected short-term borrowing costs and compressed risk appetite.
The latest completed, clearly attributable US spot fund session in the Farside Bitcoin ETF table was Friday, November 13, when aggregate Bitcoin fund flows were negative $185.4 million. The BlackRock IBIT line accounted for negative $143.5 million and Fidelity FBTC for negative $41.9 million. The November 16 row showed dashes for each issuer, alongside a mechanically displayed total of 0.0; that is an unreported or incomplete session, not evidence of zero subscriptions or redemptions. The distinction is material: a missing print cannot validate either a resumed bid or continued selling.
For Ethereum funds, Farside’s completed November 13 session showed a positive $2.3 million aggregate, comprising a positive $11.6 million FETH print against negative $9.3 million in the Grayscale ETH product, while the November 16 issuer cells were likewise unreported. That small Friday improvement did not reverse a week of approximately $398.9 million in aggregate ether ETF withdrawals. It is therefore too early to describe one modest positive session as a structural turn in institutional demand.
XRP fund figures require a separate coverage warning. Reporting based on the SoSoValue five-fund series placed net outflows at approximately $19.13 million for the completed November 9-13 week, including about $12.71 million from Grayscale’s GXRP and $9.40 million from Bitwise, partly offset by Franklin’s XRPZ. Other holdings-based trackers have reported smaller amounts because their coverage or valuation method differs. The reportable conclusion is that the identified series deteriorated; combining issuers and data methods from incompatible providers would exaggerate precision.
Leverage statistics demonstrate why the market can rally within a fragile broader trend. At approximately 23:02 UTC on November 16, Liqwall’s BTC derivatives feed estimated $24.9 billion of open interest, down 0.5% over 24 hours, with about $90 million of liquidations split between $31.5 million of long positions and $58.5 million of short positions. That imbalance indicates short covering had contributed to the latest rebound. Ether’s corresponding liquidations leaned toward shorts as well, but XRP’s leaned toward longs, revealing different local positioning rather than a uniform shift back to risk-taking.
Market sentiment remained profoundly cautious. The Crypto Fear & Greed Index was reported around 10, in extreme-fear territory, in Monday’s market snapshots. This is a dated sentiment observation rather than an independently refreshed Tuesday print. Extreme readings can accompany capitulation, but they can persist for days while prices remain under pressure. Liquidity, issuer-level fund demand and confirmation across asset classes are more reliable evidence of a sustained recovery than the sentiment label alone.
The editorial baseline for Tuesday is thus a stabilization attempt rather than a confirmed trend change. Bitcoin has defended the middle of the $60,000 range after trading close to $62,000 over the weekend; ether has reclaimed part of the $1,800 area; and XRP has remained below the important $1 threshold. The upcoming sessions will determine whether Monday’s modest digital-asset rebound was a healthy transfer from forced sellers to unleveraged buyers or simply a short-lived reaction to a deeply oversold market.
Bitcoin Market Analysis
BTC Narrative
Bitcoin’s immediate narrative is no longer the single-event liquidation that dominated the weekend. Its significance today lies in the contrast between a modestly firmer cryptocurrency price and a US stock market increasingly willing to reduce exposure to expensive growth assets. Late November 16 data placed Bitcoin near $65,457 on Liqwall, compared with CoinMarketCap’s separate early-Tuesday snapshot near $65,177. Both are consistent with the broad $65,000 consolidation zone; neither establishes that buyers have cleared the heavy overhead supply left by the fall from the mid-$70,000 area earlier in November.
The November 16 selloff in US equities matters in at least three transmission channels. First, funds exposed simultaneously to technology stocks and crypto can face portfolio-level volatility limits that produce synchronized risk reduction. Second, a rising dollar makes dollar-priced risk assets more expensive in other currencies and tends to restrain global speculative leverage. Third, confidence in liquidity-sensitive assets may erode when investors interpret an AI-sector correction as evidence that previously dependable growth expectations require revision. These are plausible mechanisms, not a claim that stock selling directly caused every Bitcoin trade.
The Reuters global-markets account also recorded falling oil prices amid signs that shipping through the Strait of Hormuz was improving. Brent crude was reported around $92.20 and US crude around $85.38 after marked declines. Lower oil could eventually improve the inflation outlook, but it should not be described as an immediate reversal in Federal Reserve policy. Energy prices, inflation persistence and the central bank’s reaction function operate on different timescales. In a market pricing a possible December rate hike, that distinction matters.
The institutional-demand story remains constrained by reporting timeliness. The last completed Farside Bitcoin ETF observation is the November 13 session, not the still-empty November 16 row. Across November 9-13, the published daily totals were negative $201.0 million, negative $95.0 million, negative $299.8 million, negative $284.1 million and negative $185.4 million, or approximately $1.065 billion for the five sessions. The progressive reduction from Wednesday’s redemptions to Friday’s should be noted, but it is not an inflow. Neither the total nor any individual issuer’s unreported Monday activity can be inferred from market prices.
BlackRock’s IBIT accounted for a large share of the prior week’s Bitcoin outflows. That concentration creates two competing interpretations. The first is that a major and highly liquid vehicle remains an efficient channel for institutional de-risking, leaving Bitcoin vulnerable to additional selling during US hours. The second is that, if those withdrawals slow, the pace of net supply hitting spot venues could change quickly because redemptions are disproportionately concentrated. Without a completed Monday issuer table and reliable cross-venue transaction detail, neither interpretation deserves the label confirmed.
Corporate treasuries offer a different, more episodic channel of support. Reports on November 16 said Strategy had acquired 485 Bitcoin during the preceding week, a purchase much smaller than daily global trading activity. Its willingness to add exposure may support the long-run adoption argument, but one corporate buy does not offset billions of dollars of multiweek ETF redemptions mechanically. Capital allocation by a leveraged public company is also not equivalent to broad asset-manager flows; the funding source, treasury concentration and market timing differ considerably.
A related analytical error is to read exchange volume, futures turnover and ETF money flow as interchangeable measures of demand. CoinMarketCap’s Bitcoin 24-hour reported turnover is a broad market-activity measure; it includes transactions occurring on venues and in circumstances not directly comparable with net creation or redemption of exchange-traded fund shares. Futures open interest shows the value of outstanding derivative positions, not how much cash has entered Bitcoin. A rally accompanied by liquidations of shorts can take place even as underlying fund flows remain adverse.
In the short term Bitcoin’s relative stability against a 2.5% decline in the Nasdaq is worth watching, but only in conjunction with cash-market depth. If the next completed ETF report shows stabilizing issuer flows and the price holds above the recent consolidation area despite another weak equity session, the divergence becomes more credible. If equities open lower, dollar strength continues and Bitcoin breaks back below the weekend recovery area, yesterday’s resilience may prove to have been nothing more than timing differences between markets.
BTC Technical & Liquidity Structure
The reference area near $65,000 lies between the weekend washout around $62,000 and the more meaningful overhead supply region near $67,500-$68,200. The first local support is approximately $64,000-$64,500, a zone traversed repeatedly in the post-liquidation rebound. Below it, the $61,950-$62,200 region corresponds to the reported weekend low. These are structural zones based on recent observable quotes rather than a claim that all exchanges share identical resting orders at the same price.
The immediate resistance lies around $65,900-$66,200, where the rebound has repeatedly encountered supply, followed by a broader $67,500-$68,200 band. A sustained four-hour and then daily close above that upper band would improve the technical interpretation by reducing the probability that the recovery is merely a corrective bounce within a descending channel. Until then, upside momentum must contend with sellers whose reference points were established during earlier, higher-price consolidations.
Derivatives offer additional context. Liqwall showed roughly $90 million of BTC liquidations over 24 hours at the late Monday cutoff, with short liquidations exceeding long liquidations. Its estimate of cross-exchange open interest was $24.9 billion, down 0.5% over the same interval, and average eight-hour funding was modestly positive at approximately 0.0050%. Those measurements suggest the market was not simply receiving large new leveraged long commitments; some of the price recovery was consistent with positions closing after an abrupt decline.
Liquidation-map estimates should be treated as conditional positioning indicators, not guaranteed orders. Liqwall identified substantially more potential long liquidation exposure within 10% below the market than short liquidation exposure within 10% above, with a notable theoretical cluster near $61,000 on one venue. Such maps are model-dependent, change as collateral and positions move, and do not prove a particular level will be reached. They are useful mainly for understanding why a break of support could accelerate when market depth is thin.
The relationship between market cap and turnover is also instructive. A reference $1.31 trillion Bitcoin market capitalization and roughly $31.75 billion of reported 24-hour volume does not imply that $31.75 billion of new purchasing power entered the asset. Turnover counts trading activity, including offsetting transactions, and market capitalization values the circulating supply at a reference price. In periods of broad deleveraging, large notional volumes can coincide with very limited incremental capital formation.
A stronger technical recovery would combine stable or rising spot-market depth, reduced forced selling, declining concentration of ETF redemptions and a higher series of daily lows. The most defensible signal is not any single hourly candle; it is persistence after the US cash session and during Asian hours, when the available liquidity, participation and headline cadence change. That cross-session behavior is especially important when US technology shares are experiencing unusual volatility.
BTC Forecast
The base case is choppy consolidation roughly between $62,000 and $67,500 while investors distinguish a mechanical bounce from a durable turn. Under that scenario the price can repeatedly test $64,000-$66,000 without establishing a direction. A completed ETF session showing stabilization, together with a calmer Nasdaq and a less aggressively rising dollar, would make the upper side of that range more plausible. Continued redemptions or renewed equity stress would shift attention back toward lower support.
The upside scenario requires more than a brief cross above $66,000. A sustained close through approximately $67,500-$68,200, with improved cash participation and more balanced fund flow, would open a test of the psychological $70,000 area. The argument would be significantly stronger if gains came alongside flat or rising open interest without disorderly funding, rather than another short liquidation spike. These are conditional market conditions, not price targets with assigned probabilities.
The downside scenario begins with a decisive loss of $64,000, followed by another test of roughly $62,000. If that zone fails amid thin order books or renewed selling in technology shares, the round $60,000 level and the liquidity beneath it become relevant reference points. Nothing in the available data establishes an exact floor. More importantly, a negative Monday ETF print, if eventually reported, would need to be evaluated by issuer and against actual trading conditions, not assumed to be the proximate cause of a move already under way.
From a risk-management standpoint, a technical signal occurring before the relevant US fund-flow data are reconciled deserves a narrower conclusion than the same signal with confirmed institutional participation. Bitcoin may have completed a local forced-sale episode without completing a broader valuation adjustment to higher real yields, stronger dollar conditions and weaker appetite for speculative growth. The coming data will help determine which process is dominant.
Ethereum Market Analysis
ETH Narrative
Ethereum is facing a different version of the same market stress. Its price recovered toward the low $1,800s after the weekend decline, but the institutional-flow record shows a much weaker preceding week than the small positive ETF reading on Friday might imply. The latest CoinMarketCap reference was around $1,823, with market capitalization approximately $222.95 billion and reported 24-hour trading volume near $11.9 billion. The combination describes a liquid large-cap asset, not proof that the underlying investment base has stopped contracting.
Ether’s significance extends beyond a directional trade in crypto beta. It is the settlement asset and collateral foundation for a broad range of decentralized-finance activity, tokenized products and stablecoin transfers. Those uses can sustain underlying network relevance even when spot prices are weak. The complication is that network utility and token returns are linked imperfectly: adoption can increase while fee compression, changing layer-two activity or broader risk aversion limit demand for holding ETH outright. Equating transaction growth with immediate price appreciation would overstate the evidence.
The completed Farside Ethereum ETF table showed net withdrawals of roughly $398.9 million across November 9-13, even though November 13 itself ended slightly positive at $2.3 million. At the issuer level the Friday FETH inflow was $11.6 million and the Grayscale ETH line declined $9.3 million. This is a useful sign that money was not leaving every product simultaneously; it does not outweigh withdrawals earlier in the week, particularly the $184.6 million aggregate outflow on Monday and $144.8 million on Wednesday.
The Monday November 16 Ethereum ETF row was not fully populated in the data examined for this report. A mechanically displayed zero alongside issuer dashes is therefore ignored. Institutional allocators should distinguish a confirmed reversal in aggregate flows from a temporary slowdown or a single-fund purchase. This distinction becomes more important for ether when broad market confidence is low, because small positive trading sessions can appear dramatic after an extended losing streak without changing medium-term positioning.
The overnight US technology selloff affects Ethereum not only through portfolio risk limits but through expectations for digital infrastructure investment. Ether is often valued partly as exposure to financial applications, developer ecosystems and future tokenization; investors may apply higher discount rates to those expectations when long-duration growth assets underperform. That connection is a valuation analogy, not evidence that any particular technology company determines activity on Ethereum. Immediate market price behavior remains sensitive to spot liquidity, the dollar and portfolio positioning.
Relative performance also warrants care. A small percentage rebound in ether after a sharper drawdown can be consistent with greater downside volatility rather than fresh leadership. Analysts should examine the ETH/BTC ratio and the durability of spot demand rather than relying solely on whether ETH has gained more than BTC over an arbitrary 24-hour window. In a market where the least liquid assets have recently experienced forced selling, a modest improvement in one day’s relative return is insufficient evidence of broad risk appetite returning.
The issuer-level data point to a key monitoring question: is the demand profile stabilizing across multiple Ethereum products or only within a single fund? The answer matters because diversified demand is generally more resistant to one intermediary’s allocations. It also affects the interpretation of fund-flow headlines that imply a single large investor group speaks for the entire market. When the ETF universe spans products with different fee structures, distribution channels and investor bases, aggregate data can conceal important shifts.
For the next session Ethereum’s own fundamental catalysts remain secondary to capital-market conditions. New network developments and ecosystem activity deserve attention when independently verified, but there was no adequately established major protocol milestone in the current research cutoff that should displace the stronger observable factors: fund withdrawals during the prior week, a fragile rebound from oversold prices and a US macro environment repricing technology risk. Avoiding an invented catalyst is itself part of reliable market reporting.
ETH Technical & Liquidity Structure
Ethereum’s latest reference zone is approximately $1,800-$1,830. The November 16 feed showed $1,832 near the late-UTC cutoff and CoinMarketCap a nearby $1,823. More important than that modest difference is the recent structure: a rebound from the reported low near $1,711, a test of $1,785-$1,800 during Monday trading and overhead supply near $1,840-$1,865. This places ether between a recovered psychological threshold and resistance that has not yet been convincingly cleared.
Support is initially $1,785-$1,800, broadly aligned with Monday’s reported low region, followed by $1,710-$1,725. A sustained break of the latter could expose $1,650-$1,675, including derivative positioning estimated around $1,676 on Liqwall’s Hyperliquid map. Resistance is near $1,865 and then $1,915-$1,935, where recent rebound levels and modeled liquidation concentrations intersect. Such areas are guideposts, not exchange-independent price guarantees.
At 23:02 UTC, Liqwall estimated Ethereum open interest near $12.7 billion, slightly below the previous 24-hour period, with aggregate eight-hour funding around negative 0.0012%. Reported 24-hour ETH liquidations totaled roughly $61.4 million, of which $38.6 million involved shorts and $22.8 million longs. That indicates some bearish positions were forced out as the market rebounded, while the mildly negative funding rate suggests positioning remained defensive rather than euphorically long.
Negative funding does not mean all traders are short. Liqwall’s Binance account metric indicated roughly 71.5% of accounts with ETH positions were on the long side, while its funding measure was negative. These statistics use different denominators: account counts, position notional and funding mechanics need not align. A small number of large positions can exert more influence on the funding market than a larger number of smaller accounts. Treating those readings as contradictory would reflect a misunderstanding of the data.
Model-estimated liquidation concentrations around $1,916 above and $1,676 below further illustrate a market with potentially volatile reactions on both sides of the price. Their existence does not imply that both levels will trade, nor that an options or derivatives model can replace actual executable order-book depth. The most useful interpretation is that leverage can amplify price changes after a local break, particularly when spot buyers have not demonstrated consistent follow-through.
Ethereum’s technical setup therefore sits between an improving short-term price and an unresolved longer-term flow picture. An advance to $1,915 without stronger unleveraged demand could become a vulnerable squeeze. Conversely, persistent support above $1,800 despite macro turbulence would offer a credible early indication that the liquidation phase is losing force. A sequence of confirmed closes and fund reports would carry more weight than isolated intraday prints.
ETH Forecast
The base case is rotation around $1,800-$1,865, with investors waiting for fuller ETF reporting and a clearer external risk backdrop. The $1,785-$1,800 support band is the first test of whether the rebound is attracting real bids on declines. A failure to hold it would imply the market has not yet established a durable intermediate floor, even if the stronger Friday ETF print is eventually followed by additional isolated inflows.
An upside case would require an advance through $1,865 and subsequently through $1,915-$1,935, ideally supported by improved ETH/BTC relative strength, positive or at least stabilizing spot fund flows and trading volume that is not entirely derivative-led. A move into the low $2,000s would then become technically plausible, but describing that outcome as likely on the basis of current evidence would be premature. The relevant trigger is sustained acceptance above resistance, not the first price spike through it.
The downside case would be reinforced by a close below $1,785 and especially by renewed trade beneath $1,710. In that event $1,650-$1,675 becomes the next structural area to monitor. Macro developments could compound the move if dollar strength or technology-stock volatility intensifies; however, the precise timing of any spillover cannot be inferred from the direction of US stock indexes alone. Ether also remains exposed to asset-specific changes in funding, network economics and collateral usage.
For institutional assessment the important distinction is between Ethereum’s operational network relevance and the market’s willingness to hold ETH as a volatile asset. The two can diverge for extended periods. A sound forecast should therefore combine observable price structure with fund creation and redemption data, derivatives positioning, network activity that is actually measured, and the macro cost of capital. No single category is sufficient in isolation.
XRP Market Analysis
XRP Narrative
XRP presents the most visible psychological test among the three major assets in this report: it continues to trade below $1 after losing that threshold during the recent selloff. CoinMarketCap showed approximately $0.9594 in the early Tuesday research snapshot, consistent with Liqwall’s $0.9589 at 23:12 UTC Monday. Its reported market capitalization was near $60.94 billion, with approximately $2.05 billion of 24-hour turnover. Below a round-dollar level that investors had recently treated as support, small rebounds may encounter supply from holders trying to reduce exposure.
The XRP-specific fund picture has weakened but requires careful methodology. SoSoValue-linked reporting showed a negative $19.13 million five-fund total during November 9-13, including a substantial Grayscale redemption and a smaller offsetting Franklin inflow. Another tracker using holdings-based estimates showed a smaller net outflow because product coverage and calculations differed. One cannot merge those observations into a supposedly superior total without reconciling the underlying products and definitions. The reliable finding is a deterioration in the named five-fund flow series, not a universally settled dollar amount for every related investment vehicle.
The distribution of weekly XRP flows is itself instructive. Grayscale’s GXRP and Bitwise recorded withdrawals while Franklin’s XRPZ recorded an inflow, according to November 16 reporting. That pattern resembles a combination of investor de-risking and selective product allocation rather than a uniformly negative judgment on the entire XRP ecosystem. Differences in fees, distribution and investor populations may matter, but available numbers do not establish the motivations of individual buyers or sellers.
XRP’s market function also differs from Bitcoin’s reserve-asset narrative and Ethereum’s smart-contract settlement role. Discussion of XRP often centers on payments infrastructure, institutional integration, token liquidity and the regulatory treatment of investment products. Those themes require evidence for each claimed deployment; a broad association with cross-border payments is not a substitute for measurement of transactions or actual XRP demand. At the current cutoff, recent fund redemptions and cross-asset risk appetite are more directly observable than any unverified new commercial agreement.
The break beneath $1 has increased the danger of narrative oversimplification. A psychological level does not automatically trigger a permanent revaluation, and a temporary recovery through it would not prove that all selling pressure has disappeared. Round numbers matter because they are easy reference points for discretionary decisions and automated risk limits. Their significance is therefore conditional on repeated trading behavior, volume, liquidity and the wider market, not an inherent economic value attached to a decimal boundary.
Relative performance should be assessed in context. XRP’s week of fund outflows coincided with marked declines across BTC and ETH, and a market-wide reduction of leverage. The available data do not establish that an XRP-specific operational breakdown caused its price decline. Conversely, market-wide weakness does not erase the informational content of its own fund flows. The most useful analysis separates the common macro factor from differences in liquidity, product coverage and derivative positioning.
The absence of a comprehensive, reconciled November 16 XRP ETF total is especially important. Weekly observations through Friday can be reported with their named data providers, but they cannot fill a Monday reporting gap. The correct approach is to distinguish the completed weekly trend from the latest market price, then monitor the next fund report for whether the pace of redemptions is accelerating, stabilizing or reversing. A flat missing cell must never be silently interpreted as zero.
For an investor monitoring institutional engagement, XRP currently offers a useful case study in the difference between fund assets and fund flows. A fund’s asset value can decline simply because the token’s price falls, even if its token inventory changes little. Net dollar redemptions measure a different process. Treating the entire decline in fund net assets as cash withdrawn would overstate actual selling pressure; using fund share counts, token balances and dated prices would improve any deeper analysis.
XRP Technical & Liquidity Structure
The immediate XRP trading region is approximately $0.94-$0.98, with the live reference near $0.959. The first support area is $0.94-$0.945, close to the reported Monday lows, while the more important downside structural band lies around $0.89-$0.90, reflecting the weekend washout. Above current prices, $0.985-$1.00 is the first resistance region and $1.02-$1.03 represents a more demanding recovery threshold. All bands are approximate and derived from recent observed price zones rather than a proprietary order-book estimate.
The derivative structure is notably different from Bitcoin’s. Liqwall estimated about $971 million of XRP open interest at 23:12 UTC on November 16, down 2.7% over 24 hours. Aggregate eight-hour funding was negative approximately 0.0058%. Its reported $3.3 million in 24-hour liquidations tilted toward longs, with about $2.1 million of bullish positions forced out and $1.3 million of shorts liquidated. That is consistent with XRP’s recovery being more fragile than an asset whose recent bounce has primarily squeezed shorts.
XRP’s Binance account ratio was more than 73% long according to the same source, despite negative average funding. Again, accounts and notional exposures differ; negative funding reflects the balance of futures contract pricing and positions, not a simple vote count. The more useful detail is the simultaneous decline in open interest and persistence of negative funding, which suggests a market still reducing or rebalancing leverage after the weekend dislocation.
A modeled liquidation concentration near $0.889 lies below the spot reference, while another smaller cluster was indicated around $0.985 above. Such map levels change as positions open, close or add collateral. They should not be treated as deterministic barriers or magnets. Their practical use is to identify places where a relatively modest move could generate forced transactions and briefly distort price, especially when market depth is thin or the broader sector is already volatile.
The $1 threshold deserves attention but not mysticism. A short move back above it would remove some near-term psychological pressure, while a sustained recovery through approximately $1.02 would better suggest that buyers have absorbed the supply created by the breakdown. On the downside, repeated failures at $0.98 followed by a loss of $0.94 would strengthen the case for retesting $0.90. These are conditional interpretations requiring confirmation, not trade instructions.
Market turnover near $2 billion over 24 hours confirms that XRP remains actively traded, but it does not establish deep, stable executable liquidity at every price. During stress, spreads and available order size can change faster than headline volume. ETF holdings, centralized exchange order books and perpetual futures each represent different mechanisms. They should be integrated carefully rather than reduced to one headline liquidity metric.
XRP Forecast
The base case is continued trading below $1, roughly between $0.94 and $0.99, while the market waits for more authoritative evidence of institutional demand. A stable BTC price, a calmer equity tape and no further deterioration in XRP fund flows could permit gradual reabsorption of the recent breakdown. That outlook remains conditional because the current structure still shows weak spot momentum and leveraged exposure that has not uniformly turned supportive.
The upside scenario becomes more credible after repeated closes above $0.99-$1.00 and a decisive recovery of roughly $1.02. A subsequent extension toward $1.08 could be considered only after that resistance is accepted rather than immediately rejected. Confirmation would ideally include improving fund flows within the same consistent tracker series, stable or recovering spot liquidity, and derivatives positions that do not exhibit an unsustainable increase in leverage.
The downside scenario follows an inability to hold $0.94. A fresh test of $0.89-$0.90 would then become plausible, with $0.85 as a lower reference only if another liquidation wave develops. The recent decrease in XRP open interest can reduce the amount of leverage available for a further cascade, but it cannot eliminate price risk from spot selling or an external shock. The severity of any break would depend on available bids and cross-market conditions at the time.
For XRP, the decisive next evidence is whether the product-level flow divergence narrows and whether price can reclaim $1 without immediately reverting. A simple comparison of the two numbers would be inadequate: if the recovery is financed mainly by derivatives while fund investors continue to redeem, the market may remain vulnerable. Conversely, coordinated strength in price, spot depth and consistently measured funds would make the upside argument materially stronger.
Key Levels and Forecast Table
| Asset | Current Area | Key Support | Key Resistance | Base Case | Upside Scenario | Downside Scenario |
|---|---|---|---|---|---|---|
| BTC | $65,000-$65,500 | $64,000-$64,500; $61,950-$62,200 | $65,900-$66,200; $67,500-$68,200 | $62,000-$67,500 consolidation | Sustained recovery above $68,200 opens $70,000 | Loss of $62,000 exposes $60,000 |
| ETH | $1,800-$1,830 | $1,785-$1,800; $1,710-$1,725 | $1,865; $1,915-$1,935 | $1,800-$1,865 rotation | Break above $1,935 permits low-$2,000s test | Break below $1,710 opens $1,650-$1,675 |
| XRP | $0.95-$0.96 | $0.94-$0.945; $0.89-$0.90 | $0.985-$1.00; $1.02-$1.03 | $0.94-$0.99 below $1 | Recovery above $1.02 may open $1.08 | Loss of $0.94 exposes $0.89-$0.90, then $0.85 |
Final Assessment
The market’s primary challenge on November 17 is a shortage of confirmation rather than a shortage of narratives. Bitcoin has stabilized around $65,000, but the US technology sector suffered a steep Monday selloff and the dollar remained strong. Farside’s November 16 issuer rows were not reconciled at the reporting cutoff, so no defensible claim can be made about that session’s spot Bitcoin or Ethereum ETF demand. For the latest completed November 13 session, Bitcoin funds still lost $185.4 million while ether funds registered only a small $2.3 million net gain.
The asset-level distinctions matter. Bitcoin’s derivatives figures suggest short-covering played a role in the rebound, yet the modeled liquidation exposure beneath the price remains sizable. Ethereum’s slightly negative funding and small Friday ETF improvement sit against a substantially negative week and unresolved resistance above $1,900. XRP combines a damaged $1 technical threshold, consistent negative funding and a recent five-fund ETF outflow trend. Treating the three markets as interchangeable would obscure precisely the differences an institutional reader needs to monitor.
The upcoming external catalysts are concrete but their effects are uncertain. Investors will scrutinize the next completed ETF sessions, Federal Reserve communications and the market-implied path for December rates. Technology investors will also assess Nvidia’s anticipated results and leadership commentary, as well as the proposed Anthropic public offering, after Monday’s broad AI-related decline. These events must be distinguished from outcomes already known: scheduled announcements can shift expectations, but their results should not be written into the market narrative before they occur.
A constructive scenario requires some combination of quieter technology-market volatility, a dollar rally that stops intensifying, confirmed moderation in fund withdrawals and price recoveries that persist without excessive leverage. The negative scenario is renewed cross-asset selling, another wave of spot fund redemptions and failures at the support bands described above. Neither set of triggers provides a reliable numerical probability, and available liquidation estimates are dynamic model outputs rather than guarantees.
The overarching assessment is one of provisional stabilization under macro pressure. Bitcoin’s ability to remain near $65,000 after a severe US equity session deserves attention, but a durable recovery would need cash-market and institutional-flow evidence that is not yet available. Ethereum and XRP face additional product-specific and leverage-related tests. Until those measures improve, the most defensible institutional approach is to separate observed facts from incomplete data, treat forecasts as scenarios and avoid mistaking a mechanical rebound for a confirmed change in the market’s underlying capital flows.