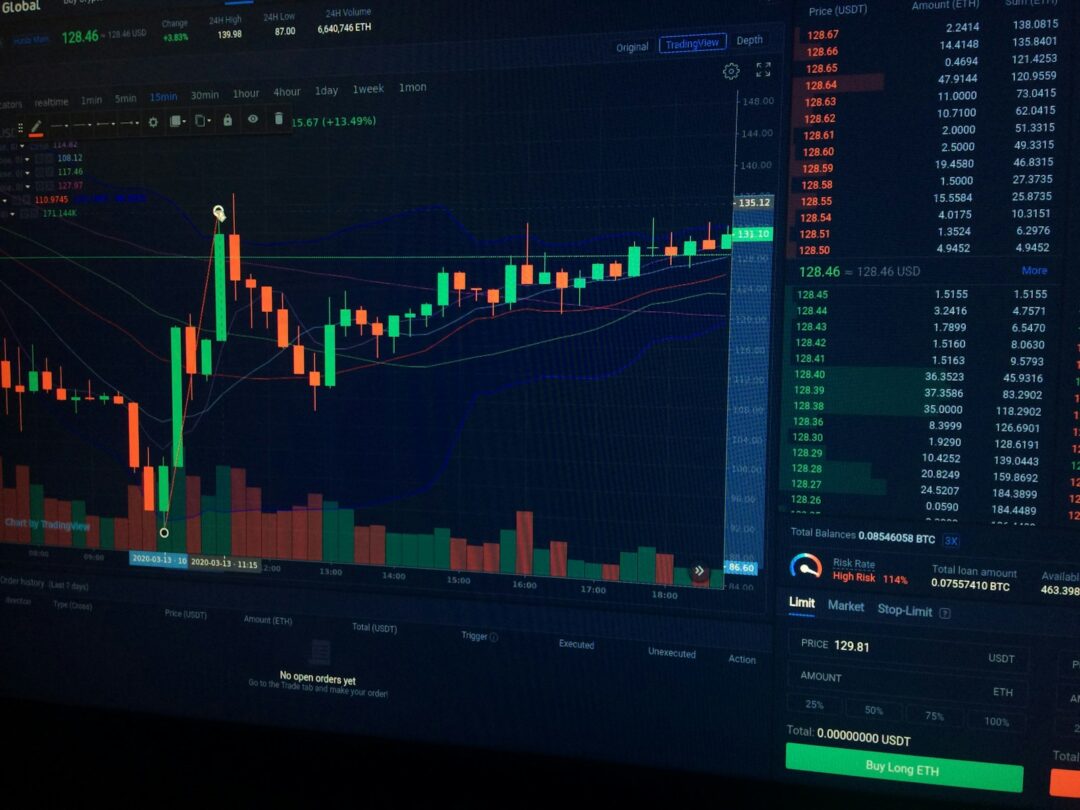
Market Overview
The digital-asset market entered Wednesday, November 11, 2026, in Asia under renewed pressure after a stronger-than-expected U.S. consumer-price report sent Treasury yields and the dollar higher. Bitcoin was quoted around $73,660, ether around $2,043 and XRP around $1.06 in the CoinGecko reference snapshots retrieved around the 08:30 Japan time editorial cutoff. These are observation-time quotes, not synchronized exchange executions or fixed closing prices. The central question has shifted from whether cryptocurrencies can stage a mechanical rebound to whether that rebound can survive a less favorable interest-rate environment.
Bitcoin’s reference price was about 1.8% lower over 24 hours and 5.4% lower over seven days. Ether had fallen approximately 3.8% and 10.7% over the same periods, while XRP had lost roughly 3.4% and 17.5%, respectively. The differences are more useful than a simple comparison of dollar losses: they show that the latest shock has had progressively more severe consequences for assets outside Bitcoin. The weekly figures also place Tuesday’s inflation reaction within a longer retreat rather than a single isolated trading session.
CoinGecko placed Bitcoin’s circulating market value near $1.48 trillion, ether’s near $249.6 billion and XRP’s near $67.1 billion. Reported 24-hour trading volume was approximately $30.4 billion for BTC, $13.6 billion for ETH and $2.22 billion for XRP. These figures describe activity reported by the data provider across venues, not immediately executable order-book liquidity at a particular price. A market can generate substantial turnover while still experiencing shallow bids during a rapid repricing, especially when leveraged orders arrive together.
The immediate macro catalyst was the U.S. Bureau of Labor Statistics’ October CPI report, released on November 10. Headline consumer prices increased 0.4% from September, compared with a 0.3% market expectation, while the measure excluding food and energy rose 0.3%, against an expected 0.2%. Both readings were above consensus even though the headline monthly pace slowed from September’s 0.6%. The difference between a deceleration and a positive surprise matters: markets price inflation relative to expectations and the expected path of policy, not simply relative to last month’s number.
Within the CPI components, shelter increased 0.3% and contributed more than 30% of the monthly headline gain, food advanced 0.5%, and energy rose 0.7% after September’s unusually large 5.2% increase. The agency could not publish a normal 12-month comparison for many October indexes because comparable October 2025 data were unavailable following a lapse in federal appropriations. Consequently, readers should not substitute an extrapolated annual inflation number for an official year-over-year CPI release. The confirmed evidence is the monthly reading and its composition.
The bond-market response tightened the financial conditions against which speculative assets are valued. Reuters reported that the U.S. two-year Treasury yield rose about 18 basis points to 4.73% and the ten-year yield gained more than 12 basis points to around 4.99% during Tuesday’s trading. The Nasdaq Composite fell about 0.74%, while the dollar strengthened. A higher risk-free yield raises the hurdle for investors to allocate to assets that do not produce contractual cash flows, and the sharp adjustment simultaneously complicates leveraged positioning and cross-asset collateral management.
Federal Reserve communication added a policy dimension. Reuters’ November 10 account described officials as open to a faster tightening pace, with market participants discussing the possibility of a half-percentage-point increase at the December 8–9 meeting. That possibility is not a decision or an assured outcome. The relevant change for crypto is that investors must now consider a more restrictive distribution of future policy rates, rather than relying on an easy-liquidity rebound as a default assumption.
Institutional cash-flow evidence remains negative, with an important reporting boundary. Farside Investors’ Bitcoin ETF table showed a finalized $201.0 million net outflow for the U.S. session of Monday, November 9. Its ether ETF table showed a $184.6 million net outflow for the same session. The November 10 rows were still blank across issuers at the cutoff; displayed aggregate zero placeholders are not confirmed zero flows. This report therefore treats November 9 as the latest completed and reconciled session, rather than inventing a number for Tuesday.
Composition is as important as the aggregate. Bitcoin’s November 9 outflow was dominated by BlackRock’s IBIT, which shed $213.2 million, while Morgan Stanley’s MSBT recorded $22.1 million of subscriptions and ARKB lost $9.9 million. Ether’s session included a $119.3 million withdrawal from ETHA, $25.0 million from Grayscale’s ETH product and $20.8 million from ETHB, partly offset by a smaller inflow elsewhere. These data reveal meaningful investor rotation among products, but the industry-level direction was still toward withdrawals rather than net fresh allocations.
XRP fund information is less standardized, yet the available specialized trackers also point to pressure. A November 10 report citing SoSoValue placed net U.S. spot XRP fund outflows for the November 9 session at approximately $10.42 million, with a large share attributable to Bitwise’s product. A separate tracker reported an approximately $10.4 million loss for the same day. Because the session definitions, product coverage and cumulative totals differ across trackers, the daily number should be read as attributed rather than an independently audited cross-provider reconciliation; a comprehensive November 10 XRP total was not yet verified.
Derivatives compound the cash-flow picture but should not be confused with it. CoinGecko showed perpetual-futures open interest of roughly $47.1 billion in BTC, $26.7 billion in ETH and $2.36 billion in XRP at observation time. Its eight-hour aggregate funding indicators were about +0.0078% for BTC, -0.0025% for ETH and +0.0089% for XRP. Those cross-venue estimates describe the price of leveraged exposure and the stock of outstanding positions, not newly received ETF capital or immediately available cash liquidity. Positive funding in a falling market can signal a still-crowded long bias; negative funding may show defensive positioning but does not establish a durable bottom.
The larger liquidation episode occurred earlier in the week, not necessarily within the latest 24-hour window. The Block reported on November 9 that CoinGlass had recorded more than $1.15 billion in liquidations over the preceding 24 hours, principally long positions. Its time window should not be relabeled as Wednesday’s live liquidation total. The actionable lesson is the demonstrated fragility of leveraged exposure in a market already experiencing redemption pressure, rather than a claim that the same amount is being liquidated again today.
Sentiment is cautious but not uniquely explanatory. CoinGecko’s displayed Fear & Greed measure was 37, classified as Fear, when the reference pages were retrieved. Such indexes summarize prevailing price, volatility and behavioral inputs; they do not measure uncommitted purchasing power. The immediate calendar also matters: Wednesday is the U.S. Veterans Day holiday, with American equity trading scheduled to continue but the Treasury market closed, potentially complicating direct yield comparisons until normal bond trading resumes. The next scheduled U.S. inflation-related release is the October producer-price report on Friday, November 13, according to the BLS calendar.
Bitcoin Market Analysis
BTC Narrative
Bitcoin’s decline has been orderly in its latest quoted level relative to the violent early-week selloff, but it has not convincingly restored the technical structure damaged by that episode. CoinGecko’s recent 24-hour range ran from about $72,744 to $75,328, while a separate Bitstamp historical series showed a November 8 low near $73,500. That history places $73,000–$73,500 at the center of the current struggle. A price oscillating near this band after a macro shock cannot be called stabilized solely because it is no longer making a new low in every hour.
The November 10 CPI print directly affects the traditional financing channels through which Bitcoin has gained broader participation. Treasury yields influence hedge funds’ borrowing costs, the attractiveness of short-duration cash instruments, and the willingness of multi-asset managers to carry large positions with volatile drawdowns. The effect is not a mechanical one-for-one relationship between yields and Bitcoin; short squeezes or crypto-specific supply changes can dominate individual sessions. Nevertheless, simultaneous increases in yields and the dollar create a measurable headwind for a market attempting to absorb net withdrawals from listed vehicles.
Institutional ETF flows have weakened over several sessions. Farside’s finalized U.S. Bitcoin totals were negative $430.2 million on November 5, negative $411.9 million on November 6 and negative $201.0 million on November 9, after a one-day positive reading on November 4. Those three negative sessions add to approximately $1.04 billion in withdrawals. The sequence does not mean a corresponding sum of spot Bitcoin must have been sold on the same trading dates; funds use creation-redemption mechanisms and market makers may hedge across instruments. It does show that the listed ETF complex has recently been a source of net redemptions rather than an automatic buyer.
The issuer-level divergence argues against describing the outflows as uniform institutional capitulation. On November 9, IBIT lost more than the net sector total while MSBT attracted subscriptions. That may reflect product preferences, tax decisions, portfolio reallocations or execution arrangements, none of which can be uniquely inferred from the table. The important distinction is that redistribution among wrappers cannot neutralize aggregate pressure when the net number remains negative. A sustainable recovery would be more convincing if both the broad aggregate and the dominant funds improved rather than only a small subset switching to inflows.
Security and political developments remain part of the risk premium. Reuters reported that U.S. bank supervisors sought information about potential banking-system exposure following the late-October Binance cyber incident. Separately, the agency documented a post-midterm crypto selloff accompanied by uncertainty about future legislative and regulatory oversight. Neither a supervisor’s inquiry nor an election result constitutes a finding that Bitcoin’s underlying protocol has failed. Both can, however, delay institutional allocations by increasing operational review and compliance scrutiny.
The supply narrative therefore demands more discipline than a simple claim of scarcity. Bitcoin’s issuance schedule is relatively predictable, and its circulating stock is large; short-horizon price nevertheless depends on the marginal willingness of investors to finance exposure. Redemptions from ETFs, treasury reallocations, basis-trade unwind activity and forced futures closures can temporarily dominate the rate of new issuance. That distinction explains why an asset with a long-term scarcity thesis can suffer sharp short-term losses when funding conditions tighten.
For an institutional desk, the critical distinction now is between a defensive consolidation and the first stage of a liquidity-driven recovery. A defensive consolidation may exhibit lower realized volatility but declining participation and intermittent rallies that fail near former support. A healthier recovery would show firmer spot volumes on advances, less concentrated funding, narrower dislocations and at least a cessation of confirmed ETF net outflows. Treating those indicators as separate conditions avoids overstating the message from a single positive price candle or a temporary bounce in futures.
BTC Technical & Liquidity Structure
The most immediate observed Bitcoin support sits around $72,700–$73,500, encompassing the fresh 24-hour range floor and the low-$73,000 trading zone. This is a practical monitoring band, not a mathematical certainty or a promise that bids will hold. The lower edge is especially important because a sustained trade beneath it would indicate that buyers could not defend levels tested after both the early-week liquidation episode and the subsequent inflation surprise.
Above the market, the first resistance band is $75,000–$75,500. The lower edge is a conspicuous round-number pivot and the upper edge is close to recent recovery attempts and the observed 24-hour high. A sustained recovery through this area would reduce immediate downside momentum, but would not erase the broader damage. The next zone is approximately $76,000–$77,000, where the recent multi-day consolidation and prior price action create a more demanding test of supply.
Broader resistance remains near $79,000–$81,000, including the region associated with the rapid rise and reversal in early November. The area matters because market participants who entered during the rebound may use renewed strength to reduce exposure. Resistance can weaken with repeated tests and strengthened buying, but that process needs observable evidence; the quoted band is a working scenario marker rather than an exchange-verified standing sell wall.
The derivatives context warrants caution even if price begins to climb. CoinGecko’s estimated Bitcoin perpetual open interest near $47.1 billion and positive eight-hour funding indicate that bullish financing costs were not universally extinguished. A rally led primarily by a renewed build-up in leveraged longs can reverse faster than one accompanied by firm cash buying. Conversely, if funding moderates while spot prices hold support, the risk that fresh long positioning immediately overwhelms bids may diminish.
Liquidity should be evaluated at several levels: reported total turnover, displayed order-book depth, executable spread and realized slippage. The approximately $30.4 billion reported 24-hour BTC trading volume is a useful market-activity reference but provides no guarantee that an institutional-sized order could execute without moving price. Exchange depth is not evenly distributed, and market makers may reduce inventory tolerance when Treasury yields reprice rapidly or cross-asset volatility rises.
A four-hour chart is appropriate for identifying shorter-term swing levels, but it cannot independently establish the economic durability of a trend. The accompanying TradingView panel uses the Binance BTCUSDT pair; its historical exchange prices and intraday candles can differ from CoinGecko’s consolidated reference. Analysts should keep these measurement systems separate rather than treating a reference-price observation as an exact Binance closing value.
BTC Forecast
The base case is for Bitcoin to rotate between approximately $72,700 and $75,500 while investors absorb the inflation surprise and await clearer evidence about fund flows. This case assumes no immediate market-wide credit event and no rapid reversal in U.S. rate expectations. It is a range-based conditional assessment, not a projected settlement price. A narrowing range with easing leverage would be consistent with stabilization; renewed large negative sessions in ETF data would make it less persuasive.
The upside scenario requires a decisive reclaim of $75,500 followed by sustained trading above $76,000–$77,000, ideally supported by less negative or positive finalized ETF flows. Under those conditions, the market could revisit $79,000–$81,000. A short squeeze alone could briefly reach the same destination, but its quality would differ substantially if funding became more expensive and spot demand failed to follow through. Investors should distinguish the speed of a move from the breadth of its participation.
The downside scenario begins with a sustained breach of $72,700. Such a move would expose approximately $70,000–$71,000 as the next analytical zone and create scope for a deeper reassessment if redemptions or liquidations accelerate. The lower level is a scenario extension of the recent price structure, not a claimed historical support order or liquidation heat-map reading. Conditions that would reinforce it include falling risk assets, a stronger dollar and more aggressive expectations for Fed tightening.
There are also asymmetric event risks. U.S. Treasury bond-market closure on Veterans Day may temporarily suppress the usual live interest-rate reference, whereas Bitcoin will continue to trade around the clock. When regular bond trading resumes, fresh yield levels could produce another repricing. A surprisingly benign PPI reading on November 13 might reduce the pressure, but one data point would not necessarily reverse the implications of persistent core CPI. An adverse PPI surprise could make the downside scenario more probable without making it inevitable.
Ethereum Market Analysis
ETH Narrative
Ether is carrying a heavier short-term burden than Bitcoin. Its roughly $2,043 reference price represents a larger 24-hour and seven-day decline, and it trades closer to the psychologically important $2,000 area. Its 24-hour CoinGecko range was about $2,010–$2,133, meaning a test of the round-number floor is no longer distant. At the same time, the market is assigning a meaningful valuation to Ethereum’s network utility, settlement infrastructure and smart-contract ecosystem; the current price action is about the willingness to own that exposure under restrictive financing conditions, not proof that those applications have ceased to function.
The most immediate institution-specific issue is continuing fund withdrawal. Farside’s completed November 9 figure was a $184.6 million net outflow from U.S. spot ether ETFs. BlackRock’s ETHA recorded negative $119.3 million, ETHB negative $20.8 million and Fidelity’s FETH negative $19.1 million, with other issuers contributing to the net result. The prior two completed sessions, November 5 and November 6, were also negative. That pattern is particularly relevant to ETH because a market already lagging Bitcoin has less scope to absorb sustained professional-investor redemptions without improving demand elsewhere.
Ether’s more pronounced sensitivity reflects several overlapping mechanisms rather than one simple causal explanation. ETH participates in the valuation of decentralized finance, staking and application activity while also functioning as a liquid trading asset on institutional and offshore venues. When portfolio managers shrink crypto risk, ETH can therefore face selling associated with both broad market exposure and discretionary views on the health of smart-contract activity. None of these channels can be quantified fully from an ETF flow table alone, but they help explain why ETH/BTC can weaken during a common macro shock.
Derivative positioning adds a different signal from Bitcoin’s. CoinGecko placed ETH perpetual open interest near $26.7 billion, representing a much larger proportion of Ethereum’s circulating market capitalization than the analogous BTC ratio. The reference eight-hour funding estimate was slightly negative, about -0.0025%. Negative funding suggests that shorts may be paying longs in the aggregated venues covered, but it is not automatically bullish. It can indicate hedging demand, defensive positioning or a persistent short preference that survives until a catalyst changes expectations.
It is also important not to confuse staking economics with fixed-income equivalence. ETH staking rewards compensate participants for network validation and involve operational, protocol, liquidity and price risks. When short-term U.S. yields rise sharply, the opportunity cost of carrying a volatile token changes even if its on-chain use remains steady. Product structures may differ in whether and how staking exposure is available, so a blanket statement about ETF investors receiving the same yield as direct stakers would be inaccurate.
The recent security environment creates a further distinction between protocol integrity and ecosystem counterparty risk. A large exchange breach or an operational failure at a service provider can damage investor confidence in custody and market plumbing without demonstrating a compromise of Ethereum’s consensus protocol. Nevertheless, ETH is frequently used for settlement, collateral and token transfers across the wider crypto ecosystem, making changes in counterparty confidence relevant to the price of leveraged exposure.
The most convincing bullish development for Ethereum would not simply be a brief recovery above $2,100. It would combine a return of consistent cash demand, improvement in ETH/BTC relative performance, a stabilization of open interest and signs that institutional withdrawals are diminishing. Until then, interpreting all rebounds as durable renewed interest in decentralized applications would ask the price action to carry more explanatory weight than the verified evidence supports.
ETH Technical & Liquidity Structure
For ether, first support lies around $2,000–$2,020, reflecting the observed 24-hour low and the nearby round-number threshold. The difference between a brief intraday print below $2,000 and repeated four-hour closes beneath it would matter considerably. A single transient violation could reflect thin liquidity or stop orders; sustained trade below the zone would suggest a broader re-evaluation of buyers’ willingness to defend the level.
Initial resistance is roughly $2,100–$2,135, covering the upper portion of the latest observed range. Above it lies the broader $2,180–$2,250 zone, whose significance comes from earlier November price structure and the market’s failure to hold the recovery. Ether’s greater weekly decline means that even a successful test of first resistance could coexist with a still-weak medium-term trend.
Leverage quality matters more than headline notional. The approximately $26.7 billion of reported perpetual ETH open interest is not equivalent to $26.7 billion of immediately available selling pressure, and outstanding longs necessarily coexist with opposing positions. Funding and open-interest changes can help identify whether a breakout is being driven by new speculation, short-covering or potential hedging. They do not establish which side owns a profitable or unprofitable position without more granular data.
The ETH TradingView panel follows Binance ETHUSDT four-hour candles. Its venue-specific values may differ from consolidated reference-price data and from official ETF share-pricing calculations. For risk control, the most useful combination is to compare its observed swing structure with independently sourced cash-flow developments, rather than choosing whichever chart level happens to support a desired forecast.
ETH Forecast
The base case is a choppy $2,000–$2,135 trading range with tentative rebounds vulnerable to renewed selling. Such a pattern would be consistent with mildly negative derivatives funding, poor recent relative performance and incomplete evidence of a turnaround in ETF demand. Market participants should monitor whether ether holds the lower band while Bitcoin remains supported, because continued ETH underperformance would signal that capital is still concentrating in the largest cryptocurrency.
The upside case begins with a sustained move through $2,135 and improved participation above $2,180, with a potential extension toward $2,250. A recovery accompanied by narrower fund outflows, stronger ETH/BTC and normalized funding would carry more weight than a short-driven spike. A crypto-wide relief rally after softer inflation data could facilitate the move, but the macro catalyst would need to be matched by asset-specific confirmation.
In the downside case, consecutive breakdowns below $2,000 would raise the risk of movement into approximately $1,900–$1,950. This is a prospective analytical zone, not a claim that specific exchange liquidation clusters have been independently mapped. With ether’s leveraged market large relative to its capitalization, an abrupt loss of an important round number could produce an outsized short-term response if stop and margin orders concentrate around it.
The policy backdrop is not purely negative. A less hawkish interpretation of subsequent economic releases or a clear reversal in Treasury yields could improve crypto financing conditions quickly. The evidence threshold should remain higher for ether than for Bitcoin, however, because ETH has already shown greater sensitivity in both price and ETF withdrawals during this episode. A change in policy expectations is a potential catalyst; confirmed asset-level inflows would be the more direct sign that it has translated into actual demand.
XRP Market Analysis
XRP Narrative
XRP’s position is distinctive because its latest weakness combines the same macro financing shock with a more pronounced weekly decline and ongoing sensitivity to regulatory and product-market developments. CoinGecko’s reference near $1.06 was about 17.5% below its level seven days earlier, substantially worse than Bitcoin’s or ether’s corresponding performance. A market that has lost that much in a week can stage sharp percentage rebounds without necessarily regaining the prior trend, especially when confidence in the broader altcoin complex is fragile.
The nearby $1.00 level has practical psychological importance, while the observed 24-hour reference range of approximately $1.03–$1.10 gives a more precise picture of where recent trading occurred. The round number itself is not evidence of a large standing purchase order. It matters because many participants use easily remembered prices as decision points, which can concentrate discretionary activity and stop instructions even when the true order book is constantly changing.
Fund-flow data provide a timely but limited institutional read. Reports based on SoSoValue estimated approximately $10.42 million of net outflows from U.S. spot XRP funds on the November 9 session, including approximately $9.4 million from Bitwise’s XRP product. The report is directionally consistent with a second tracker, but the available sources differ on some historical cumulative measures. Those differences counsel against treating the reported cumulative dollar value as reconciled. No verified comprehensive November 10 total was available at the editorial cutoff, so there is no basis for labeling that day’s flow as zero or positive.
Relative price performance and fund demand should be read together but not conflated. XRP can underperform while its ETF products remain a comparatively small part of total turnover, just as a smaller net redemption can matter materially at the margin during poor market depth. Spot exchanges, offshore derivatives, holders rebalancing inventory and market makers all contribute to price formation. The roughly $2.22 billion 24-hour reported turnover is a broad activity measure; it cannot establish the exact share caused by ETF hedging.
XRP also carries a different infrastructure proposition from Bitcoin and Ethereum. Its ledger is associated with payment and asset-transfer applications, and its market narrative frequently responds to perceived progress in regulated distribution and institutional products. That does not make it immune to higher Treasury yields, which affect the opportunity cost of holding a volatile token just as they affect other crypto assets. Nor does an infrastructure proposition guarantee that use of payment services translates directly or proportionately into token investment demand.
Market commentary has discussed potential quantum-resistant upgrades to the XRP Ledger. Such proposals should be distinguished from approved network amendments, completed deployments and independently demonstrated production security. A technical proposal can be strategically relevant without constituting a near-term catalyst that offsets macro weakness. As of the current evidence review, no definitive activation or measurable price impact has been independently verified, so this article does not assign a specific projected gain to that development.
The wider regulatory landscape requires similar precision. The outcome of U.S. midterm elections may affect the prospects and timetable of digital-asset legislation, but political expectations are not enacted rules. Separately, questions about custody and cyber defenses have intensified following the Binance incident. An institutional investor evaluating XRP products may therefore examine legal clarity, operations and market liquidity together. These are potential channels of allocation decisions, not evidence that a specific enforcement action or new ban has taken effect.
XRP’s funding estimate was positive, around +0.0089% per eight hours, while perpetual open interest was near $2.36 billion. Positive funding during a rapid weekly decline can indicate residual appetite for leveraged longs despite the damage, making further downside sensitive to financing costs and forced position closures. The signal is not one-sided: rising prices could also force shorts to cover. What matters is whether leverage adjusts in a manner that strengthens or undermines cash-market support.
XRP Technical & Liquidity Structure
XRP’s nearest support is estimated at $1.03–$1.05, spanning the latest observed low and an area directly below the reference quote. Below it, $1.00 is the next important threshold, followed by an analytical downside extension around $0.95–$0.98. These are scenario bands derived from recent reference ranges and round-number structure, not verified clusters of hidden stop orders. A more decisive deterioration would require repeated trade below the nearby band rather than a single illiquid tick.
On the upside, first resistance lies at approximately $1.09–$1.12, covering the recent 24-hour high and the region from which selling has resumed. Additional resistance may emerge near $1.16–$1.20 as traders revisit earlier weekly prices. Because XRP’s seven-day drawdown is unusually deep, reclaiming the first band should be understood as an improvement in short-term momentum, not proof of a complete trend reversal.
Relative-strength confirmation is essential. A rebound that raises XRP/USD while XRP continues to weaken against BTC would still indicate that the token is losing share of capital within the crypto market. A stronger signal would be simultaneous improvement against the dollar and Bitcoin, less one-sided funding and more durable cash participation. This can be monitored without asserting a precise causal relationship between any single ETF transaction and a futures-market move.
The four-hour Binance XRPUSDT widget below is for visual market structure only; its candles may not equal the consolidated CoinGecko reference. Risk managers should distinguish the venue-specific chart, the cross-exchange derivatives estimate and the U.S. ETF trading-session boundary. Those observations are sourced from different mechanisms and times, so combining them into a single precise liquidation or liquidity figure would create false precision.
XRP Forecast
The base case is for XRP to remain unsettled between about $1.03 and $1.12 as the market absorbs macro news and tests whether the latest weekly decline has exhausted immediate sellers. This does not assume that institutional investment products will turn positive at the next reporting interval. A sideways pattern accompanied by narrowing realized volatility and improving XRP/BTC would be more constructive than one supported only by rising leveraged long exposure.
The upside case would require sustained trading above $1.12, followed by a successful test of the $1.16–$1.20 area. Confirmation would improve if fund-flow reporting showed stabilization and relative strength improved against Bitcoin. Because market participation has been thin enough to create abrupt swings in several altcoins, a quick bounce is possible even without those conditions; its durability would remain questionable until breadth and financing indicators improve.
The downside case begins with a sustained loss of $1.03 and then $1.00, which could expose approximately $0.95–$0.98. A fast move through the psychological dollar threshold could attract forced or discretionary sales, particularly if positive funding reflects continuing long concentration. The downside band is a working scenario rather than a forecast with a numerical probability; relevant uncertainties include exchange liquidity, the timing of fund reporting and the next macroeconomic surprise.
What would falsify this cautious assessment is not a single optimistic announcement but a confluence of observable events: XRP holding higher lows, recovering relative value against BTC, and showing more consistent institutional or cash-market demand. Conversely, a renewed macro selloff plus another confirmed negative fund session would strengthen the defensive interpretation. The distinction protects analysis from treating speculative product headlines as proof of executed investor allocations.
Key Levels and Forecast Table
| Asset | Current Area | Key Support | Key Resistance | Base Case | Upside Scenario | Downside Scenario |
|---|---|---|---|---|---|---|
| BTC | About $73,660 | $72,700–$73,500 | $75,000–$75,500; then $76,000–$77,000 | $72,700–$75,500 range while flows and yields settle | Reclaim $75,500 and $77,000; $79,000–$81,000 possible | Sustained loss of $72,700 risks $70,000–$71,000 |
| ETH | About $2,043 | $2,000–$2,020 | $2,100–$2,135; then $2,180–$2,250 | $2,000–$2,135 consolidation | Hold above $2,135 and $2,180; retest $2,250 | Loss of $2,000 exposes $1,900–$1,950 |
| XRP | About $1.06 | $1.03–$1.05; then $1.00 | $1.09–$1.12; then $1.16–$1.20 | $1.03–$1.12 unsettled range | Clear $1.12 and challenge $1.16–$1.20 | Loss of $1.03 and $1.00 risks $0.95–$0.98 |
Final Assessment
Wednesday’s dominant signal is not simply that three cryptocurrencies are declining. It is that three distinct market structures are facing the same U.S. inflation shock while showing different degrees of resilience. Bitcoin is testing a lower support zone after a multi-session ETF redemption streak. Ether is showing a larger weekly drawdown and its own concentrated fund withdrawals. XRP is underperforming still more sharply, with relatively modest but negative reported fund flows and a crowded-looking positive perpetual funding estimate.
The macro story has precise boundaries. October headline CPI was 0.4% and core CPI was 0.3% month over month, both above expectations. Yields and the dollar rose in the immediate response, and Federal Reserve officials made clearer that additional tightening is possible. But the December policy decision has not occurred. It would be an error to present either a 25-basis-point or a 50-basis-point move as predetermined; the distribution of possible outcomes is what changed.
The cash-flow story has an equally important timing boundary. November 9 is the last fully populated U.S. session verified from Farside for BTC and ETH in this review. Its finalized negative totals must not be assigned to November 10. The blank November 10 issuer cells are missing data, not net-zero readings. As further reconciled figures appear, the most useful question will be whether withdrawals are broadening, narrowing or reversing across major sponsors.
Derivatives provide evidence of continuing sensitivity but no definitive standalone forecast. The three tokens had material perpetual open interest at the cutoff, with different signs and magnitudes of funding. Earlier November 9 liquidation reports documented the market’s vulnerability to forced exits; they do not provide a current live liquidation tally. The crucial distinction for subsequent rallies will be whether price improvement is supported by unleveraged demand or primarily by aggressive futures positioning.
The next set of observations is therefore operational rather than rhetorical: monitor BTC’s $72,700–$73,500 band, ETH’s defense of $2,000 and XRP’s behavior around $1.03 and then $1.00. Above those areas, the first resistance markers are $75,000–$75,500 for BTC, $2,100–$2,135 for ETH and $1.09–$1.12 for XRP. Breaks can occur temporarily without confirming a broader change, so persistence, turnover quality and cross-asset consistency matter more than a single print.
The calendar may create uneven cross-asset pricing. U.S. equities are scheduled to trade on Veterans Day while the bond market is closed, so the next fully active Treasury session may provide a delayed read on the new inflation expectations. Friday’s October producer-price release adds another test. Further out, the December 8–9 Federal Reserve meeting remains a major policy event, but individual data releases and issuer reporting may alter expectations before then.
The central conclusion is conditional. A market that stabilizes its spot order books, moderates leverage and ends repeated fund redemptions could build a credible foundation for recovery even with interest rates high. A market that loses recent lows while yields rise and withdrawals persist faces the opposite outcome: another round of price discovery driven by constrained liquidity. The current evidence supports a cautious assessment, not an assertion that either route is guaranteed.