Key Takeaways :
- Bitcoin has entered a deep correction phase, with Q1 2026 losses exceeding 24%.
- Historical data suggests deeper drawdowns significantly delay recovery timelines.
- On-chain indicators imply the market has not yet reached full capitulation.
- Whale selling pressure and declining liquidity reinforce bearish conditions.
- Macro factors—especially interest rate expectations—may extend the cycle beyond previous patterns.
- A realistic recovery timeline may shift toward mid-2027 under current scenarios.
1. A Market Reset: Bitcoin’s 2026 Correction in Context
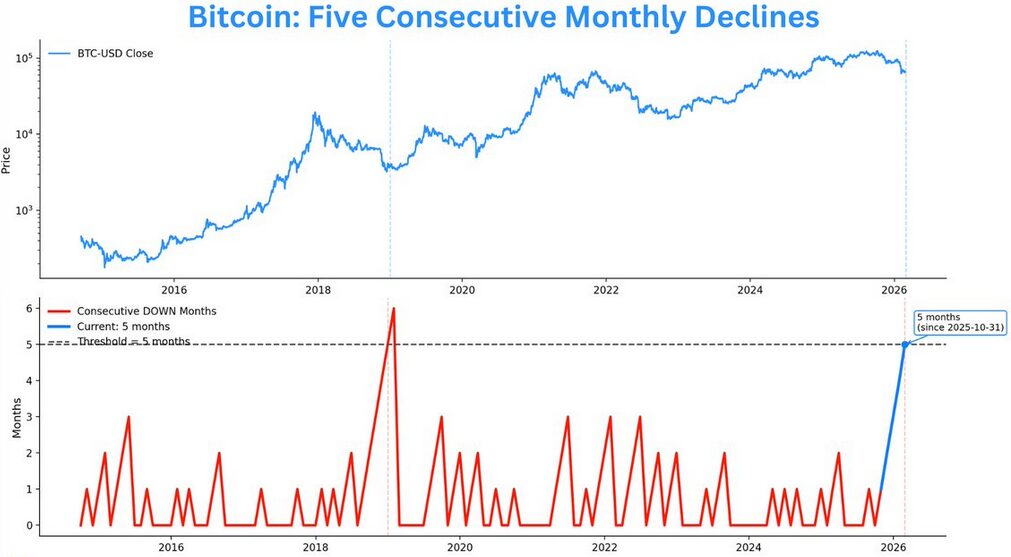
Bitcoin (BTC) has entered a decisive correction phase in early 2026, erasing all gains from March and closing the quarter with a substantial decline of approximately 24.6%. While short-term volatility is not uncommon in crypto markets, the current structure aligns more closely with historical deep drawdown cycles rather than a typical mid-cycle correction.
From its peak near $126,000 in October 2025, Bitcoin has already declined significantly, and several analysts now warn of a potential additional downside of up to 40%. This raises a critical question for investors: is this merely a temporary correction, or the early stages of a prolonged bear cycle?
Historical precedent suggests that the magnitude of decline plays a decisive role in determining recovery speed. The deeper the drawdown, the longer the market requires to reclaim prior highs. This dynamic is becoming increasingly relevant as Bitcoin struggles to find a confirmed bottom.
2. Drawdown Depth and Recovery Time: A Predictable Relationship
Data from Ecoinometrics reveals a striking correlation: for every additional 10% decline in Bitcoin’s price, the recovery period extends by roughly 80 days.
Based on this model:
- A ~48% drawdown implies approximately 300 days to recover.
- Around 172 days have already passed since the peak.
- If $60,000 represents the bottom, roughly 125–130 days of recovery remain.
However, this assumption may be optimistic. If Bitcoin experiences deeper capitulation—similar to previous cycles—the recovery timeline could extend far beyond current expectations.
For instance, if Bitcoin falls into a 60%+ drawdown range, recovery periods historically stretch to approximately 440 days or more. This would push a full return to all-time highs into mid-2027.
3. On-Chain Signals: Not Yet at Capitulation
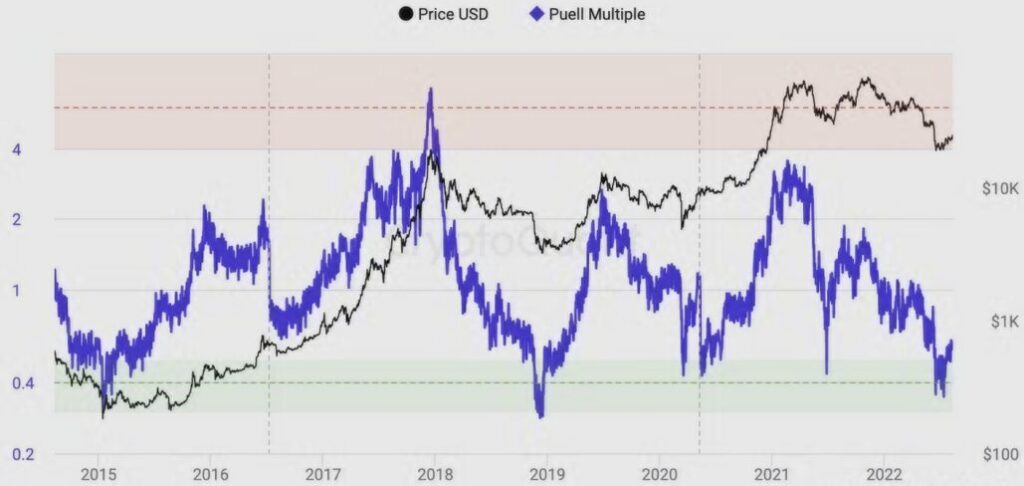
On-chain metrics provide additional insight into market positioning. A composite indicator combining MVRV (Market Value to Realized Value), NUPL (Net Unrealized Profit/Loss), SOPR (Spent Output Profit Ratio), and sentiment—often referred to as the Bitcoin Composite Market Index (BCMI)—currently sits around 0.27.
Historically, major market bottoms have occurred near 0.15:
- 2018 crash bottom: BCMI ~0.15
- 2020 COVID crash: ~0.147
- 2022 bear market bottom: ~0.12
This suggests that Bitcoin has not yet reached the levels typically associated with full capitulation. In practical terms, further downside may be required before long-term accumulation phases begin.
Data providers such as CryptoQuant emphasize that current readings remain elevated relative to prior cycle lows, reinforcing the view that the market is still in a transitional phase rather than a confirmed bottom.
4. Whale Behavior and Liquidity: Warning Signals from Smart Money
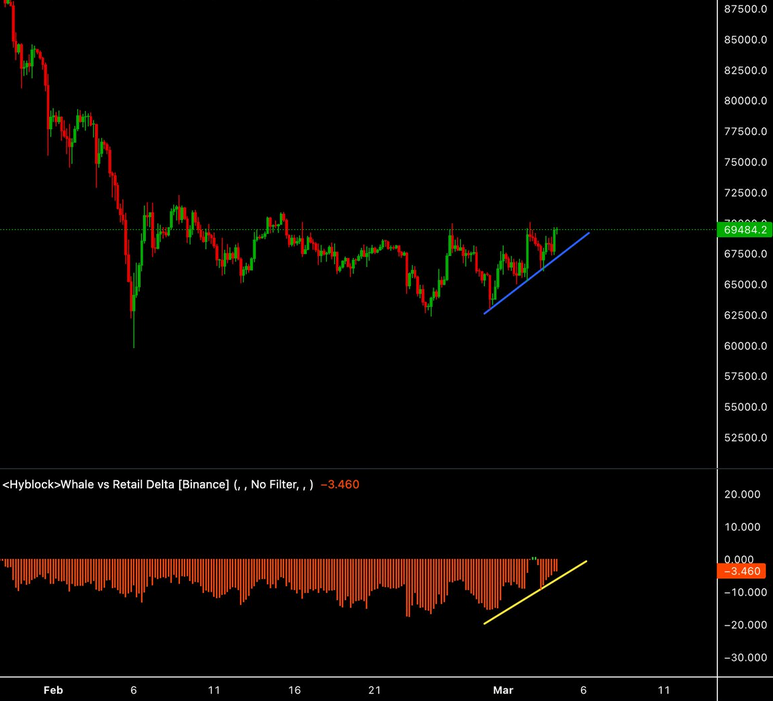
One of the most concerning signals comes from large holders—commonly referred to as whales. Data indicates that the divergence between whale and retail activity has reached its most negative level since late 2024, suggesting strong institutional or large-scale selling pressure.
At the same time, market liquidity has deteriorated across both spot and derivatives markets. Willy Woo, a prominent on-chain analyst, has pointed out that weakening liquidity conditions often precede deeper corrections.
He identifies a potential bottom range between $40,000 and $45,000, consistent with typical bear market structures. If realized, this would represent a 64–68% decline from the peak—well within historical norms for Bitcoin bear cycles.
Such a scenario would not only confirm a full reset of speculative excess but also significantly delay the timeline for recovery.
5. Macro Headwinds: Interest Rates and the Changing Cycle Structure
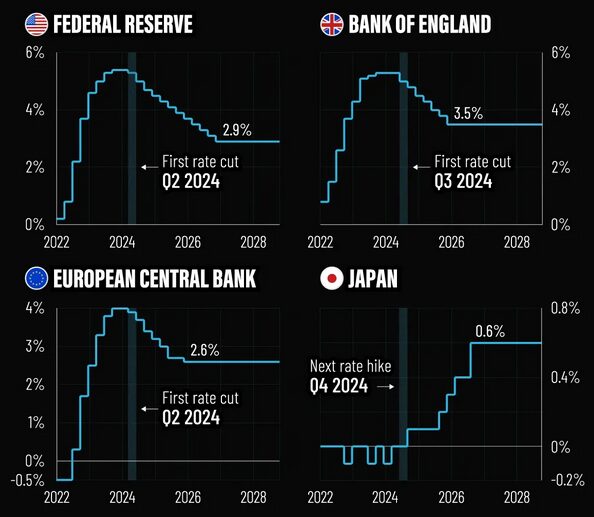
Unlike previous cycles, Bitcoin now operates within a more complex macroeconomic environment. According to The Kobeissi Letter, expectations for interest rate cuts have been pushed back significantly.
Current projections suggest:
- No rate cuts until late 2027
- A 51% probability of further rate hikes by March 2027
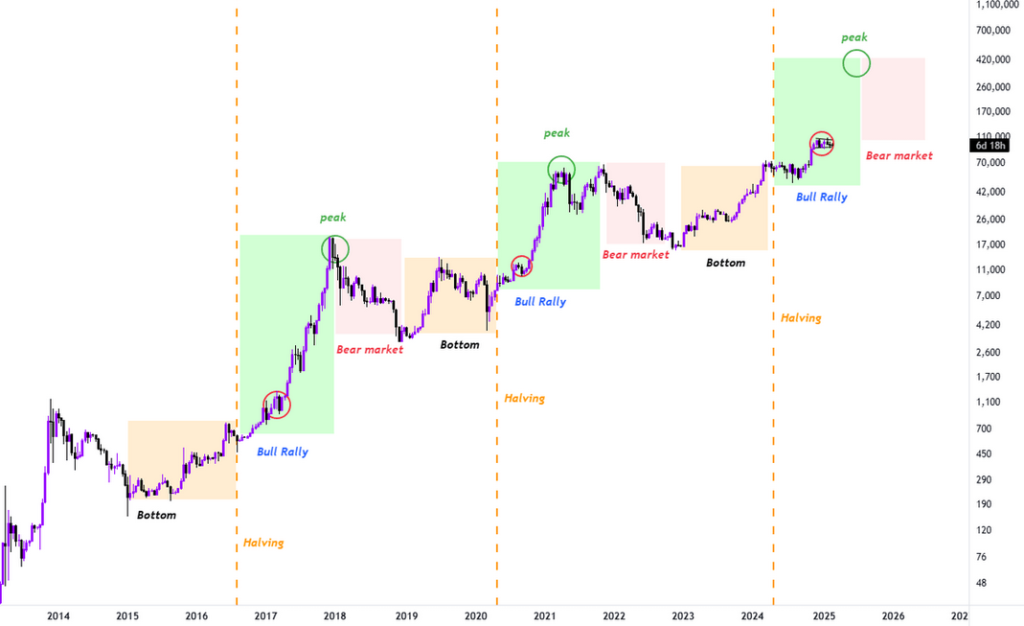
This is a critical shift. Historically, Bitcoin bull cycles have coincided with periods of monetary easing and liquidity expansion. If tight monetary conditions persist, the traditional four-year cycle may become less reliable.
In this context, Bitcoin is transitioning from a purely speculative asset into a macro-sensitive financial instrument—one that reacts to global liquidity conditions, institutional flows, and risk sentiment.
6. Scenario Analysis: What Happens Next?
Base Case (Moderate Decline)
- Bottom near $60,000
- Recovery within ~300 days
- New highs by early 2027
Bearish Case (Full Capitulation)
- Bottom at $40,000–$45,000
- Drawdown exceeds 60%
- Recovery delayed to mid-2027 or later
Macro-Stressed Case
- Prolonged high interest rates
- Weak liquidity persists
- Cycle extends beyond historical patterns
Each scenario highlights a different interaction between on-chain data, market structure, and macroeconomic forces.
7. Strategic Implications for Investors and Builders
For investors seeking new opportunities, this phase is not merely a downturn—it is a structural reset.
Historically, the most transformative crypto projects emerge during bear markets. Lower valuations, reduced noise, and increased focus on fundamentals create fertile ground for innovation.
Key areas to watch include:
- Real-world asset tokenization (RWA)
- Stablecoin infrastructure
- Cross-border payment systems
- Institutional custody and compliance tools
For builders, this is the phase where infrastructure—not speculation—defines long-term winners.
Conclusion: A Longer Road, but Not a Broken Cycle
Bitcoin’s current trajectory suggests that the next major bull cycle may take longer to materialize than many expect. The combination of deep drawdown dynamics, incomplete capitulation signals, whale-driven selling pressure, and restrictive macro conditions paints a cautious outlook.
However, this does not signal the end of Bitcoin’s growth story.
Instead, it marks a transition—from rapid speculative cycles to a more mature, macro-integrated asset class.
If history is any guide, the periods of greatest uncertainty often precede the most significant opportunities. Whether the bottom arrives at $60,000 or $40,000, the foundations being built during this phase will likely define the next decade of crypto innovation.


