
Main Points :
- Bitcoin (BTC) failed to stay above $72,000, retreated below rising support, signaling possible bearish dominance.
- Ethereum (ETH) dropped under a key breakout level at $2,111, testing the 50-day average near $2,044 and potentially heading toward $1,900 or below.
- XRP (Ripple) showed bearish dominance near moving averages and may decline toward $1.27 support, unless bullish reversal occurs.
- Solana (SOL) rejected at $95, remains under its 50-day SMA, drifting in the $76–$95 range with potential breakout moves.
- Recent macro trends — interest rate outlook, ETF flows, and BTC mining hash rates — influence short- to mid-term crypto price behavior.
Bitcoin Analysis: Support Breakdown Signals Caution
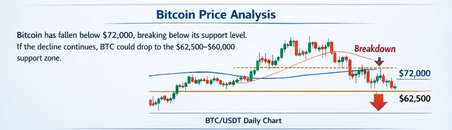
Bitcoin’s behavior in recent sessions has been one of hesitation after a prolonged rally earlier in the year. BTC’s inability to sustain above the $72,000 level triggered selling pressure, which in turn drove price below the ascending support line of a bullish triangle pattern. When Bitcoin closes below this support on a daily basis, it invalidates the bullish setup that many traders had been expecting to fuel a continuation toward higher highs. Instead, this breach suggests that bearish sentiment may be gaining traction.
In such a scenario, BTC could fall toward the $62,500–$60,000 support zone — a level that has proven pivotal in past corrections. On the upside, only a rebound above $72,000 would shift momentum back toward bulls. If bulls regain control and break above $74,508, the next meaningful run could aim for $84,000.
Recent data shows institutional Bitcoin flows — including custody inflows into ETFs — have slowed, indicating that macro concerns (inflation and interest rate outlook) are affecting risk assets broadly. Minor upticks in BTC long positions have not yet translated into price strength as sell-side sentiment continues near short-term peaks.
Ethereum Outlook: Bearish Pressure Intensifies
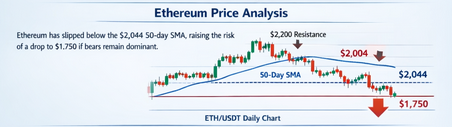
Ethereum’s price action reflects a similar bearish pressure. After failing to hold above the breakout threshold of $2,111, ETH fell under its 50-day simple moving average (SMA) at approximately $2,044. This technical signal suggests sellers have wrested short-term control.
In this context, ETH may target the $1,900 vicinity, where historically buyers have placed bids. If that level fails, the next support around $1,750 gains importance. These support zones represent areas where speculative demand could re-emerge should broader crypto sentiment shift upward.
Alternatively, a convincing resurgence above $2,200 would start to counter the bearish narrative. A further rise toward $2,400 and beyond could follow, especially if Ethereum’s fundamental catalysts — such as continued DeFi activity and ETH staking rewards — support higher valuations.
Recent on-chain data indicates that ETH outflows from exchanges have increased, reflecting hodler accumulation. However, price behavior has yet to confirm a bullish reversal, as daily volatility remains elevated.
XRP Price Direction: Moving Within Bearish Controls
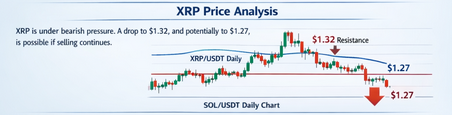
XRP’s chart action has similarly tilted bearish. The recent rejection near moving averages indicates that momentum remains on the downside, with sellers defending near current levels. XRP could slide toward $1.32 and more critically toward $1.27, which functions as a strong support zone in recent history.
At $1.27, buyers may step in to defend the level, providing a potential platform for accumulation. Failure of this support could pave the way for further decline toward multi-week lows. Bulls would require a close above the moving average to challenge the next resistance at approximately $1.61.
Fundamentally, XRP continues to see adoption narratives related to cross-border settlements and banking partnerships, but regulatory challenges (especially in U.S. jurisdictions) continue to weigh on investor confidence.
Solana Price Analysis: Testing Support Levels
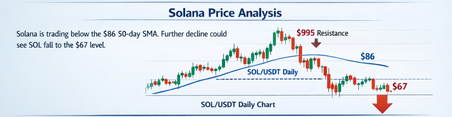
Solana’s price action has been characterized by hesitation and rejection at $95 in recent sessions. This resistance has kept the price below its 50-day moving average, indicating that bullish momentum is currently under pressure. SOL’s price has been fluctuating in a range between $76–$95, with no clear breakout direction as of now.
If Solana can manage to break above the $95 level, the next target for bulls would be around $117, with further upside potential. However, a sustained move below $76 would open the door for further declines toward $67, a level that has been historically significant as a support zone.
Recent institutional involvement in Solana’s ecosystem remains positive, with projects focused on NFTs and DeFi bringing some stability. However, broader market sentiment will likely continue to drive short-term volatility.
Conclusion
The recent price actions of Bitcoin, Ethereum, XRP, and Solana suggest that the bearish sentiment is gaining traction, with critical support levels being tested across the board. While macroeconomic concerns, such as inflation and interest rate outlooks, continue to affect crypto markets, there are still opportunities for upside if certain resistance levels are broken. Traders should be vigilant about these critical price points and remain agile to capitalize on any potential trend reversal.


