Main Points :
- Funding rates for Bitcoin and Ethereum have flipped positive, signaling strong bullish positioning
- Futures markets show aggressive long accumulation since mid-March
- Large inflows to exchanges—especially from whales—raise potential sell pressure
- Key resistance levels identified at $75,000 and $85,000
- Macro catalyst: U.S. Federal Reserve rate decision influencing market sentiment
1. A Sharp Shift Toward Bullish Futures Positioning
In mid-March 2026, a decisive shift in sentiment emerged across the cryptocurrency derivatives market. According to CryptoQuant’s latest weekly analysis, traders in both Bitcoin (BTC) and Ethereum (ETH) futures markets are increasingly positioning for short-term upside. This shift is not subtle—it is visible across multiple indicators, including funding rates, order book imbalances, and liquidation patterns.
After Bitcoin broke above the psychologically important $70,000 level, a cascade of short liquidations occurred. Traders who had previously bet against the market were forced out, creating upward momentum and opening the door for new long positions. Notably, new longs began accumulating aggressively above $73,000, suggesting growing confidence that the market had entered a renewed bullish phase.
At the same time, macroeconomic expectations are playing a role. Ahead of the U.S. Federal Reserve’s interest rate decision on March 18, traders appear to be positioning for favorable liquidity conditions. Historically, expectations of stable or declining interest rates have supported risk assets—including cryptocurrencies.
This convergence of technical breakout and macro anticipation has created a fertile environment for speculative optimism.
2. Funding Rates Confirm Market Conviction
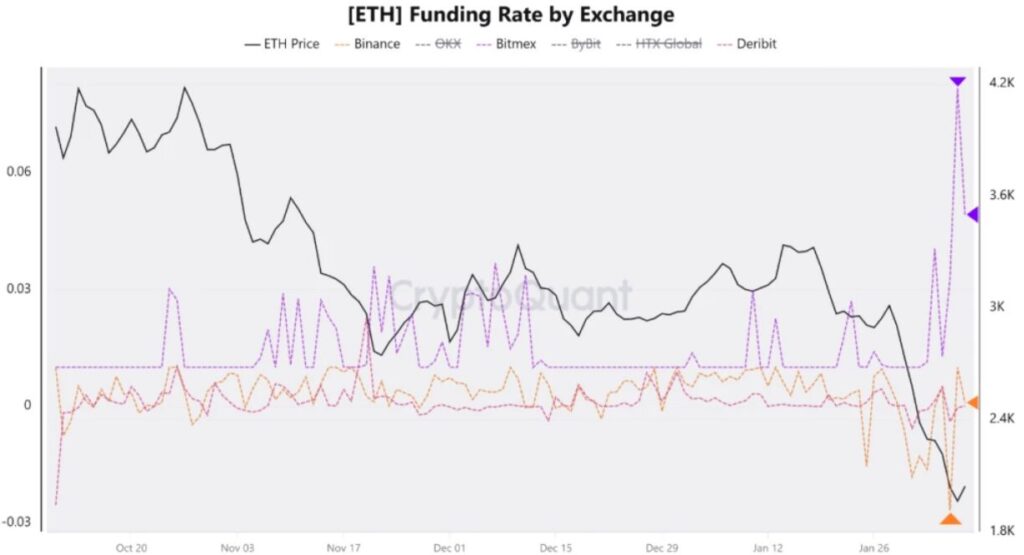
One of the clearest indicators of this bullish shift is the funding rate—a core mechanism in perpetual futures markets.
Funding rates ensure that the price of perpetual futures contracts remains aligned with the spot market. When the rate is positive, long-position holders pay short-position holders, indicating that demand for longs is dominant. When negative, the opposite is true.
Recent data shows that Bitcoin’s funding rate has transitioned from deeply negative territory into positive territory. Ethereum has followed a similar path, moving from negative back into positive levels. This transition is significant because it reflects a behavioral shift: traders are now willing to pay a premium to maintain long exposure.
Such conditions often emerge during early or mid-stage rallies, when market participants anticipate further upside and are willing to incur additional costs to stay positioned.
However, it is important to note that excessively high funding rates can also signal overcrowding on the long side—an imbalance that can lead to sharp corrections if sentiment shifts.
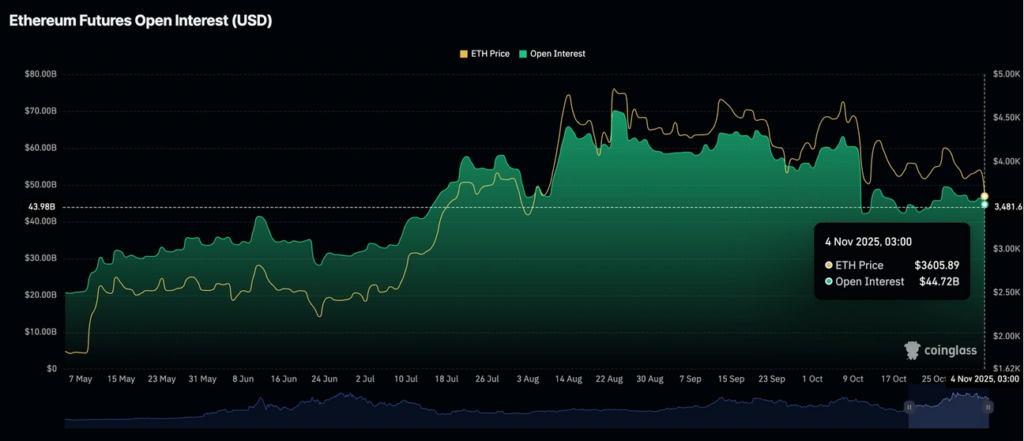
3. Order Flow and Volume: Strongest Bullish Signals Since 2025
Beyond funding rates, order flow data provides additional confirmation of bullish momentum.
Since March 12, buy orders in the perpetual futures market have consistently outpaced sell orders for both Bitcoin and Ethereum. This imbalance has reached its highest level since October 2025—a period previously associated with strong upward price movement.
The surge in buy-side pressure suggests that traders are not merely reacting to price increases but actively anticipating further gains. In many cases, this type of behavior reflects a shift from cautious participation to conviction-driven positioning.
Volume metrics reinforce this narrative. Futures trading activity has expanded significantly, indicating that the current rally is supported by broad participation rather than isolated speculation.
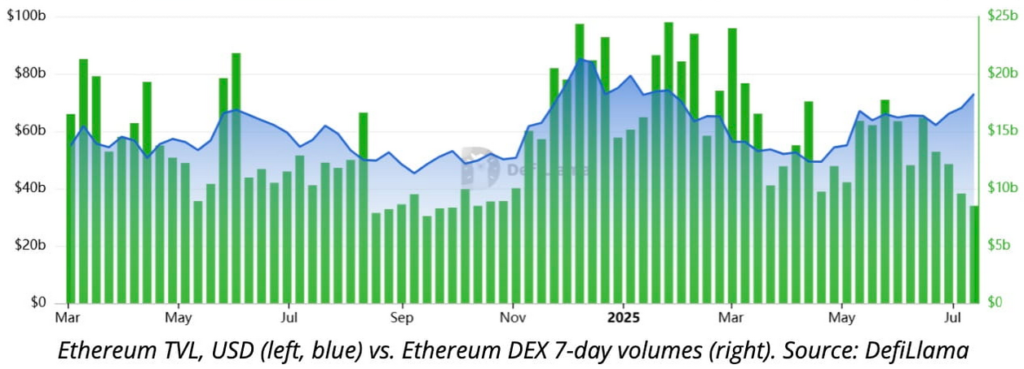
For investors and builders in the crypto ecosystem, this matters. Sustained derivatives-driven momentum often spills over into spot markets, DeFi activity, and even early-stage token speculation, creating opportunities across multiple layers of the blockchain economy.
4. The Hidden Risk: Whale Inflows and Sell Pressure
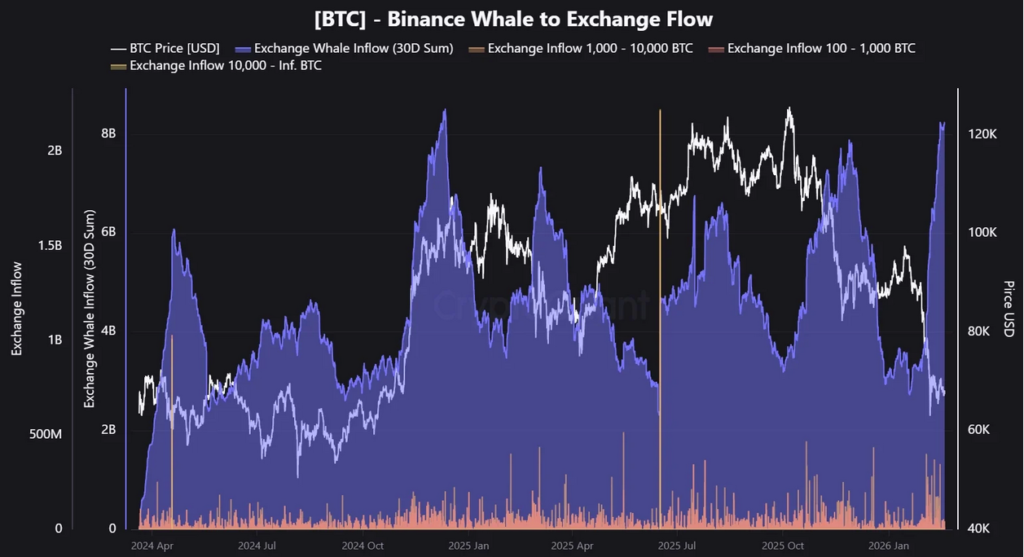
Despite the strong bullish signals, a critical risk factor has emerged: large-scale inflows of Bitcoin to exchanges.
On March 16, hourly inflows of Bitcoin to exchanges surged to approximately 6,100 BTC, marking the highest level since February 20. More importantly, 63% of these inflows were attributed to large holders (whales)—a level not seen since October 2025.
Historically, spikes in exchange inflows—particularly from whales—have often preceded increased selling activity. When large holders move assets to exchanges, it typically indicates an intention to sell or at least prepare for liquidity events.
This creates a paradox in the current market:
- On one hand, derivatives traders are aggressively bullish
- On the other hand, large holders may be positioning to take profits
This divergence between speculative positioning and underlying supply dynamics is a classic setup for volatility.
For sophisticated market participants, this is a signal to monitor closely. It does not necessarily indicate an imminent downturn, but it does suggest that upside may be capped or interrupted by periodic sell-offs.
5. Key Resistance Levels: $75K and $85K
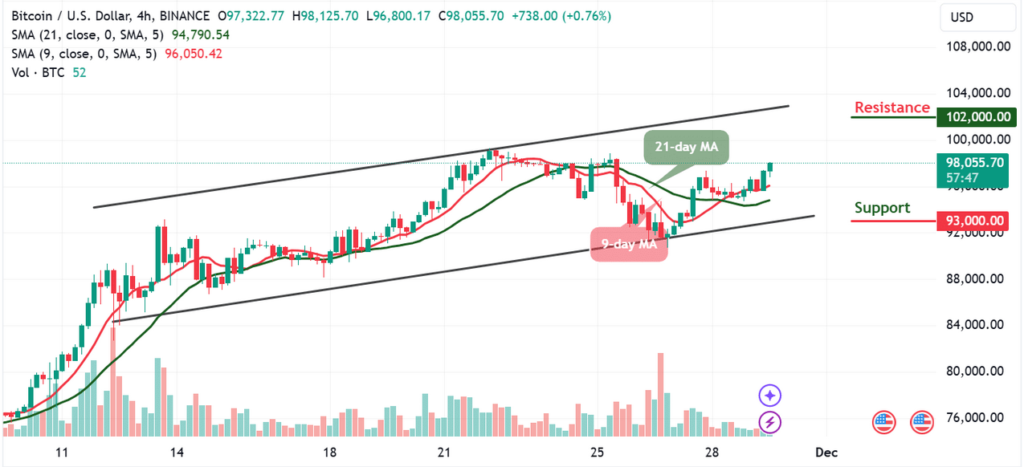
CryptoQuant’s analysis identifies two critical resistance zones for Bitcoin:
First Resistance: $75,000
This level corresponds to the lower boundary of the on-chain realized price for traders. The realized price represents the average acquisition cost of market participants.
Historically, during bearish or transitional phases, this level has acted as a strong resistance. When prices approach this zone, many traders who previously bought at higher levels may choose to exit positions at breakeven, creating selling pressure.
Second Resistance: $85,000
If Bitcoin successfully breaks above $75,000, the next major resistance lies around $85,000. This level aligns with the upper boundary of the realized price band.
Notably, this zone acted as resistance during previous rallies in January 2026 and October 2025, reinforcing its significance.
For traders, these levels are not just technical markers—they represent psychological and structural thresholds where market dynamics can shift rapidly.
6. Broader Market Implications and Emerging Opportunities
The current environment reflects a transitional phase in the crypto market—one where bullish sentiment is returning, but structural risks remain.
For investors seeking new opportunities, several implications stand out:
- Derivatives-driven momentum may continue to fuel short-term rallies
- Volatility spikes could create tactical entry points
- Altcoins and emerging tokens often benefit from Bitcoin-led momentum cycles
- On-chain data is becoming increasingly critical for anticipating market moves
Additionally, the growing sophistication of market participants—including institutional traders and algorithmic strategies—means that traditional signals must be interpreted within a broader context.
This is no longer a retail-dominated market. It is a hybrid ecosystem where macroeconomics, derivatives, and on-chain analytics intersect.
7. Conclusion: A Bullish Market With Structural Tension
The cryptocurrency market is currently exhibiting strong bullish characteristics, particularly in the futures space. Positive funding rates, rising volumes, and aggressive long positioning all point toward continued optimism in the short term.
However, the simultaneous increase in exchange inflows—especially from large holders—introduces a layer of uncertainty. This tension between bullish sentiment and potential sell pressure is likely to define the next phase of the market.
If Bitcoin can break through $75,000 and sustain momentum toward $85,000, the broader market could enter a new expansion phase. But failure to overcome these levels may trigger corrections, especially if whale-driven selling intensifies.
For participants across the ecosystem—from traders to builders—the key takeaway is clear:
This is a market of opportunity, but not without risk.
Understanding both the visible momentum and the hidden supply dynamics will be essential for navigating what comes next.

