Key Points :
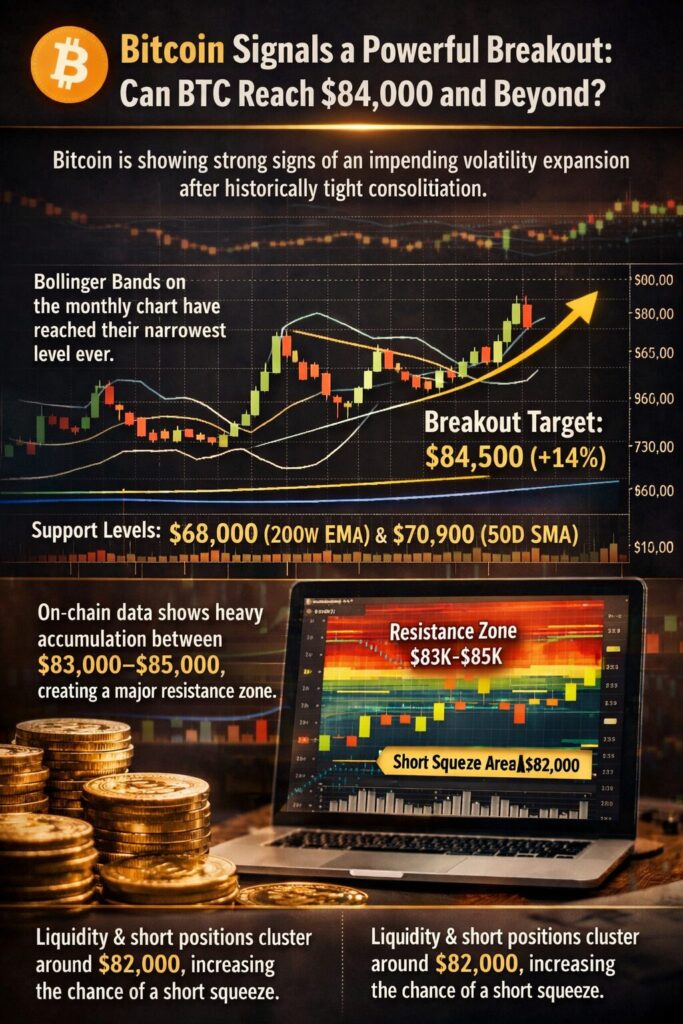
- Bitcoin is showing strong signs of an impending volatility expansion after historically tight consolidation.
- Bollinger Bands on the monthly chart have reached their narrowest level ever.
- A breakout from a symmetrical triangle suggests a potential target around $84,500 (+14%).
- Key support levels at $68,000 (200W EMA) and $70,900 (50D SMA) have been reclaimed.
- On-chain data shows heavy accumulation between $83,000–$85,000, creating a major resistance zone.
- Liquidity and short positions cluster around $82,000, increasing the chance of a short squeeze.
1. Market Context: Compression Before Expansion
Bitcoin has entered a phase that seasoned traders recognize as one of the most critical setups in the market cycle: extreme volatility compression. Historically, such compression does not persist—it resolves through a sharp and often directional move.
The most notable signal comes from the Bollinger Bands, a widely used technical indicator that measures volatility and price deviation. On the monthly timeframe, Bitcoin’s Bollinger Bands have tightened to their lowest level in history. This is not a neutral signal. It is a precursor.
Historically, similar compressions have preceded explosive rallies:
- In 2016–2017, a comparable setup resulted in a 4,000% bull run.
- Between December 2023 and August 2025, Bitcoin surged approximately 235%, reaching an all-time high near $126,000 after a similar expansion phase.
This pattern reinforces a key principle: the longer the compression, the stronger the expansion.
[Bollinger Band Compression Visualization]
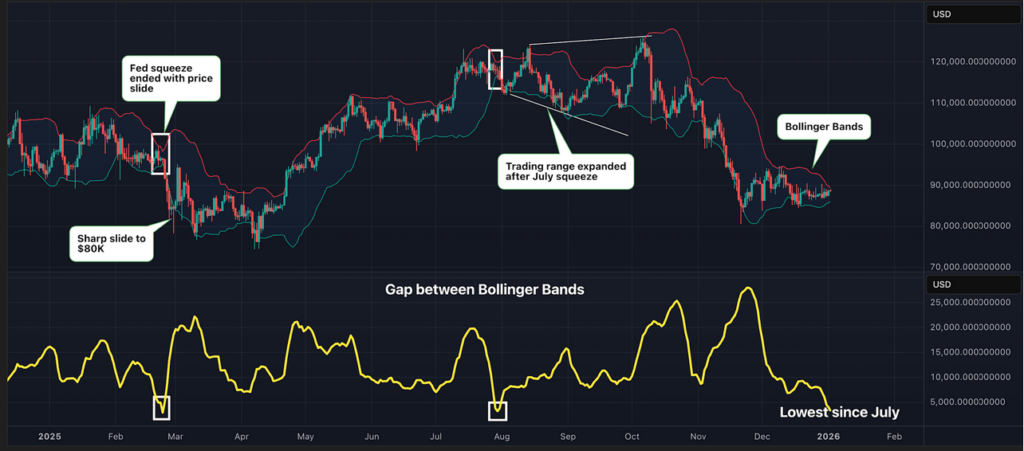
(Image description: Monthly Bitcoin chart showing tightening Bollinger Bands followed by breakout expansion phases.)
2. Technical Structure: Symmetrical Triangle Breakout
Beyond volatility signals, Bitcoin’s price structure adds further bullish confirmation. The market has recently broken out of a symmetrical triangle, a pattern characterized by converging higher lows and lower highs.
This formation represents equilibrium between buyers and sellers. When price exits the triangle, it typically moves with momentum equivalent to the height of the pattern.
- Breakout level: ~$68,500
- Current price: ~$74,400
- Projected target: ~$84,500
This suggests a ~14% upside potential in the short term.
Supporting this structure:
- RSI (Relative Strength Index) sits at 60, indicating bullish momentum without being overbought.
- Bitcoin has reclaimed major moving averages:
- 200-week EMA: $68,000
- 50-day SMA: $70,900
Reclaiming these levels is critical—it signals a transition from bearish to bullish market structure.
[Symmetrical Triangle Breakout Chart]
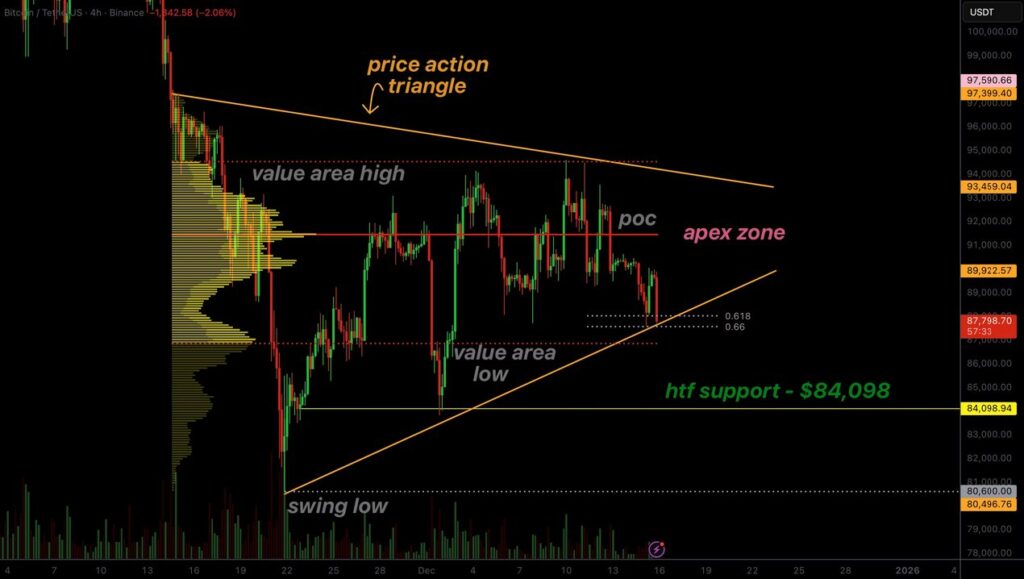
(Image description: Daily BTC/USD chart showing triangle formation and breakout with projected price target.)
3. The $84,000 Barrier: On-Chain Resistance Zone
While technicals point upward, on-chain data introduces a crucial nuance: the $83,000–$85,000 zone is heavily defended.
According to cost-basis distribution data:
- Over 898,000 BTC were accumulated in this range.
- This represents approximately 4.4% of total supply acquired between November and early February.
This matters because:
- Investors tend to defend their entry price.
- When price returns to this zone, selling pressure increases (break-even exits or profit-taking).
- It creates a gravitational resistance zone.
Additionally, this level aligns with short-term holder cost basis, making it psychologically and structurally significant.
[On-Chain Cost Basis Heatmap]
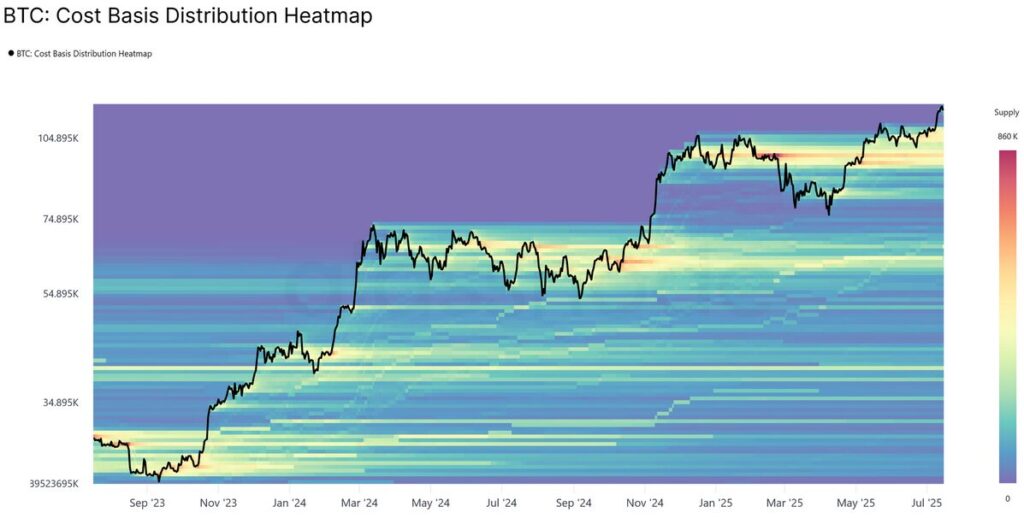
(Image description: Heatmap showing dense accumulation around $83K–$85K and lighter zones below.)
4. Liquidity Dynamics: The Short Squeeze Factor
Another critical layer is order book liquidity.
Data indicates:
- A large cluster of short positions around $82,000
- If price approaches this level, forced liquidations could occur
This creates the conditions for a short squeeze, where:
- Price rises
- Short sellers are liquidated
- Their forced buying pushes price even higher
This dynamic can accelerate Bitcoin’s move toward—or even beyond—the $84,000–$85,000 zone.
5. The “Low Resistance Gap”: Why Momentum Could Accelerate
An often overlooked but highly important factor is the lack of supply between $74,200 and $83,000.
This “thin zone” implies:
- Fewer holders are waiting to sell
- Less friction during upward movement
If Bitcoin firmly breaks out of the current range, price could move rapidly through this gap, encountering major resistance only near $83K+.
This is structurally similar to past “air pockets” where Bitcoin moved quickly due to low liquidity resistance.
6. Broader Market Trends Supporting the Move
Beyond the article’s scope, several macro and crypto-native trends reinforce the bullish case:
Institutional Accumulation
Large financial players continue to increase exposure to Bitcoin, especially through ETFs and structured products. This creates consistent baseline demand.
Supply Constraints
Bitcoin’s halving cycles reduce new supply, amplifying the impact of demand surges.
Stablecoin Liquidity Growth
Rising stablecoin market caps indicate increasing capital ready to deploy into crypto markets.
Macro Alignment
If global liquidity conditions ease (e.g., rate cuts or monetary expansion), Bitcoin historically benefits as a risk-on asset.
7. Strategic Implications for Investors and Builders
For readers seeking new crypto assets, revenue opportunities, or practical blockchain use cases, this setup is particularly important.
Trading Opportunities
- Breakout trading above resistance
- Momentum continuation strategies
- Short squeeze plays
Yield & Revenue Strategies
- Structured products based on volatility expansion
- Options strategies (straddles/strangles)
- Liquidity provisioning in derivatives markets
Builder Perspective
- Increased market activity → higher transaction volume
- Opportunities in:
- Payment rails
- Arbitrage infrastructure
- Market-making systems
For a VASP/EMI operator, this is where spread-based revenue models become highly effective.
Conclusion: A High-Probability Inflection Point
Bitcoin is currently positioned at a high-probability inflection point, where multiple independent signals converge:
- Volatility compression (Bollinger Bands)
- Bullish breakout structure (triangle pattern)
- Momentum confirmation (RSI, moving averages)
- Liquidity dynamics (short squeeze potential)
- On-chain resistance (cost basis clustering)
The path toward $84,000 is technically and structurally supported. However, this level is not just a target—it is a decision zone.
If Bitcoin breaks and holds above this resistance:
- It could confirm the end of the prior downtrend
- Trigger a new leg in the broader bull cycle
If rejected:
- Expect consolidation or temporary pullback
Either way, the current setup suggests one thing clearly:
A major move is coming—and it will likely define the next phase of the Bitcoin market.

