Main Points :
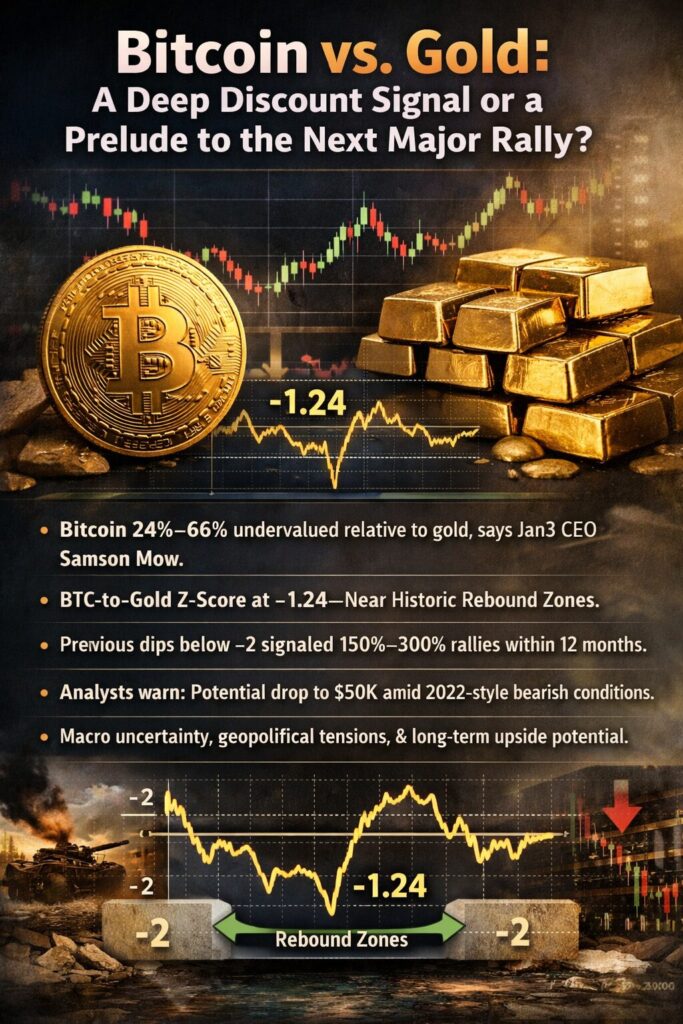
- Bitcoin appears 24%–66% undervalued relative to gold and global money supply trends, according to Jan3 CEO Samson Mow.
- The Bitcoin-to-Gold Z-score currently sits around -1.24, approaching historically significant rebound zones.
- Previous drops below -2 in the ratio preceded major rallies of 150% to 300% within 12 months.
- Some analysts warn of a potential fall toward $50,000, reflecting 2022-style bearish conditions.
- Macro uncertainty, geopolitical tensions, and liquidity cycles are shaping near-term volatility.
- For long-term allocators, relative valuation models suggest asymmetric upside potential.
I. Bitcoin Is Trading at a Discount to Gold — What Does That Mean?
Bitcoin (BTC) is currently trading around $66,400, after experiencing a drawdown of more than 50% from its recent peak, briefly touching lows near $60,000. While many traders focus on short-term volatility, a different narrative is emerging from relative valuation models.
Samson Mow, CEO of Jan3, argues that Bitcoin is currently undervalued when compared to gold’s market capitalization and global money supply expansion. According to his analysis, Bitcoin is trading roughly 24% to 66% below trend levels implied by gold’s valuation and monetary expansion metrics.
At the same time, gold futures recently closed around $5,247.90, while tokenized gold such as PAX Gold (PAXG) trades around $5,404.14, reflecting strong investor demand for traditional safe-haven assets.
This divergence between gold strength and Bitcoin weakness raises a key question:
Is Bitcoin lagging temporarily — or structurally mispriced?
II. Understanding the Bitcoin-to-Gold Z-Score
To understand this argument, we must examine the Bitcoin-to-Gold ratio Z-score.
The Z-score measures how far the current ratio deviates from its historical average:
- Z = 0 → Ratio is at historical mean
- Z > 0 → Bitcoin relatively expensive vs. gold
- Z < 0 → Bitcoin relatively cheap vs. gold
Currently, the Z-score sits around -1.24.
Historically, when the Bitcoin-to-Gold Z-score falls below -2, major rallies have followed.
Let’s examine previous cases:
1. November 2022 – FTX Collapse
During the collapse of FTX, the Z-score fell below -3. Bitcoin was trading under $20,000. Over the following 12 months, BTC surged more than 150%.
2. March 2020 – COVID Crash
During the pandemic-induced liquidity shock, Bitcoin fell to approximately $3,717, and the ratio dropped below -2. Within 12 months, BTC rallied more than 300%, eventually reaching approximately $69,000 in November 2021.
These historical precedents suggest that extreme relative undervaluation against gold has often marked cyclical bottoms.
[Bitcoin vs. Gold Ratio Z-Score Historical Chart]
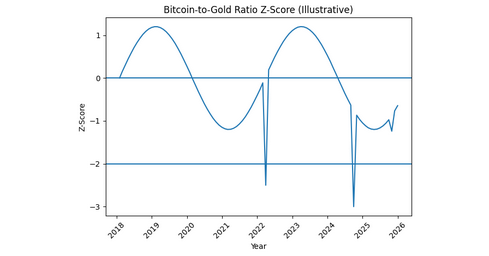
Description:
A time-series chart showing the Bitcoin-to-Gold ratio Z-score from 2018 to present, highlighting dips below -2 and subsequent price rallies.
III. The Bearish Counterargument: Could Bitcoin Drop to $50,000?
Not all analysts agree with the bullish interpretation.
Some market participants believe that current price action resembles the 2022 bear market structure. With ongoing geopolitical tensions in the Middle East and broader macro uncertainty, liquidity conditions remain fragile.
Risk assets have shown sensitivity to:
- Rising real yields
- Strong U.S. dollar cycles
- Tightening financial conditions
- Risk-off capital flows
If liquidity contracts further, Bitcoin could test $50,000, particularly if forced deleveraging accelerates.
This bearish case emphasizes that relative valuation alone does not guarantee immediate reversal.
IV. Gold’s Strength and Bitcoin’s Digital Scarcity Narrative
Gold’s rally reflects demand for inflation hedging and geopolitical insurance. Central banks have been accumulating gold at historically elevated rates over the past two years.
However, Bitcoin’s fixed supply of 21 million coins introduces a structural scarcity model that differs from gold:
| Asset | Maximum Supply | Monetary Policy | Settlement Speed |
|---|---|---|---|
| Gold | Expanding via mining | Supply elastic over time | Physical |
| Bitcoin | 21 million fixed | Algorithmically fixed | ~10 minutes |
As global money supply expands, scarce assets typically benefit. If gold has already priced in monetary expansion, Bitcoin may be lagging in that repricing cycle.
[Bitcoin vs. Global Money Supply Trend Comparison]
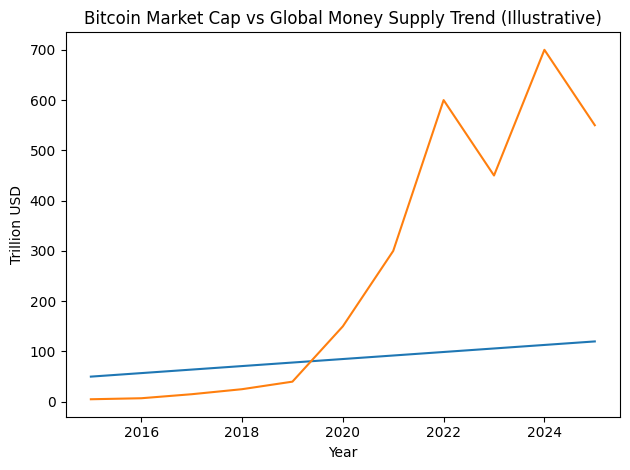
Description:
Overlay chart comparing Bitcoin market cap vs. global M2 money supply trend.
V. Tokenized Gold and the Convergence Narrative
Interestingly, tokenized gold such as PAX Gold (PAXG) demonstrates how traditional safe-haven assets are migrating onto blockchain infrastructure.
This trend signals two important developments:
- Blockchain is becoming the settlement layer for traditional assets.
- Bitcoin’s digital scarcity thesis competes directly with gold’s historical role.
As more real-world assets become tokenized, the competition between gold and Bitcoin may intensify in both financial and technological dimensions.
VI. Relative Valuation as an Investment Framework
For investors seeking new crypto opportunities or practical blockchain use cases, relative valuation models offer a strategic lens.
Rather than predicting exact price levels, they identify asymmetric risk-reward zones.
When Bitcoin trades at extreme discounts to gold:
- Downside may be limited relative to historical cycles
- Upside may expand if capital rotates back into digital assets
- Long-term holders may benefit from accumulation phases
However, timing remains uncertain. Z-scores can remain negative for extended periods before mean reversion occurs.
VII. Practical Implications for Crypto Investors
For readers searching for:
- The next high-conviction accumulation zone
- Macro-driven crypto cycles
- Blockchain adoption narratives
This divergence between gold and Bitcoin may represent a structural opportunity.
Possible strategies include:
- Gradual accumulation during relative discount phases
- Monitoring Bitcoin-to-Gold Z-score thresholds (-2 level as historical extreme)
- Diversified exposure across BTC and tokenized commodities
Institutional capital often rotates based on relative valuation, not emotional narratives. Understanding these relationships provides a professional edge.
Conclusion: Discount, Delay, or Structural Inflection?
Bitcoin currently trades in a zone that historically preceded major rallies when measured against gold. The Z-score of approximately -1.24 is not yet extreme, but it is moving toward historically significant territory.
At the same time, macro risks and liquidity constraints justify caution.
The key insight is this:
Bitcoin’s valuation relative to gold and global money supply suggests latent upside potential, but timing depends on liquidity conditions and investor psychology.
If history rhymes, current weakness could represent consolidation before expansion. If macro stress intensifies, deeper retracements remain possible.
For forward-looking crypto investors, the question is not simply whether Bitcoin will rally — but whether relative undervaluation today represents the foundation of the next structural move.