Main Points :
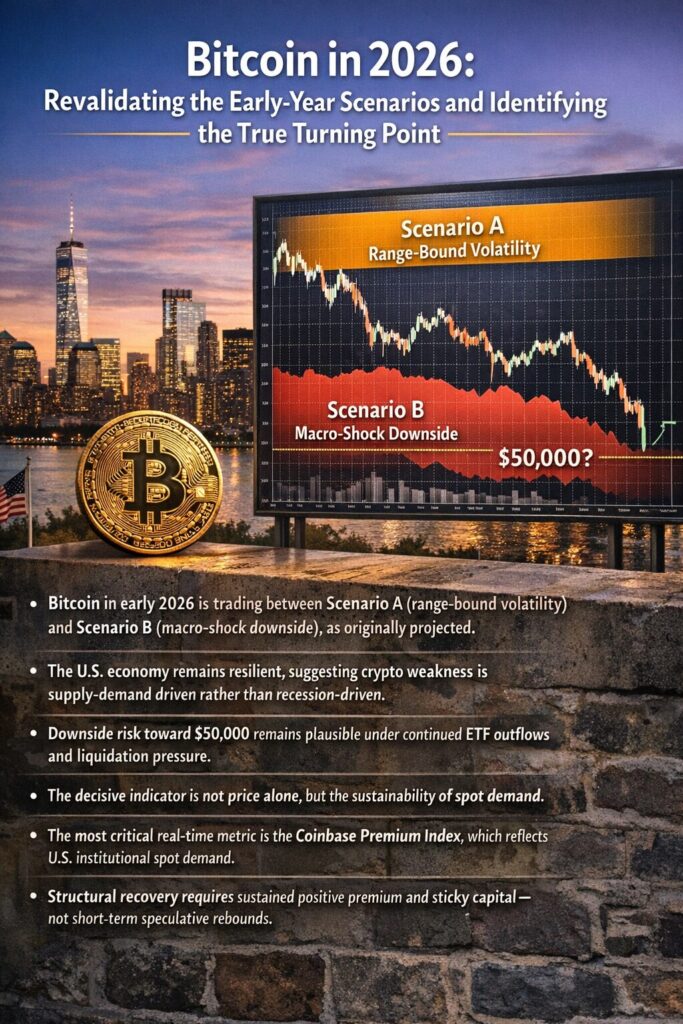
- Bitcoin in early 2026 is trading between Scenario A (range-bound volatility) and Scenario B (macro-shock downside), as originally projected.
- The U.S. economy remains resilient, suggesting crypto weakness is supply-demand driven rather than recession-driven.
- Downside risk toward $50,000 remains plausible under continued ETF outflows and liquidation pressure.
- The decisive indicator is not price alone, but the sustainability of spot demand.
- The most critical real-time metric is the Coinbase Premium Index, which reflects U.S. institutional spot demand.
- Structural recovery requires sustained positive premium and sticky capital—not short-term speculative rebounds.
I. Revisiting the January 1 Framework: Three Scenarios for 2026
On January 1, 2026, Bitcoin was trading around $95,000. XWIN Research outlined three potential paths for the year:
Scenario A: “Twisted Range” – $80,000 to $140,000
A volatile, wide-ranging consolidation. Capital flows intermittently into crypto markets but fails to anchor. High volatility persists without structural breakout.
Scenario B: “Macro Shock” – Break Below $80,000, Risk Toward $50,000
A downside case driven by external stress or crypto-specific deleveraging, potentially revisiting the $50,000 zone.
Scenario C: “Risk-On Expansion” – $120,000 to $170,000, Potential Test of $200,000
A bullish expansion scenario requiring strong macro alignment, robust ETF inflows, and sustained institutional demand.
At the beginning of the year, XWIN assigned higher probability to Scenarios A and B, while treating Scenario C as conditional and limited.
Two months into 2026, that framework remains remarkably relevant.
II. Where the Market Stands Now
The current crypto market weakness largely falls within the anticipated range. However, the broader macroeconomic environment tells a different story.
The U.S. economy has not collapsed. Employment remains stable. Corporate activity remains steady. There is no systemic credit panic unfolding. Therefore, Bitcoin is not being sold primarily due to recession fears.
Instead, the weakness appears structural and internal to the crypto market:
- ETF inflows have weakened.
- Spot demand lacks persistence.
- Liquidation-driven volatility has increased.
- Leverage remains unstable.
This hybrid condition blends Scenario A’s range-bound structure with Scenario B’s instability.
Price remains within a macro range, but market structure resembles a shock environment.
III. The Current Risk Profile: Why $50,000 Is Not Impossible
The downside toward $50,000 is not a base case, but it is no longer theoretical.
Three forces could push price toward that level:
- Continued ETF Outflows
U.S. spot ETF flows have been inconsistent. Without steady absorption of supply, selling pressure dominates. - Liquidation Cascades
High leverage in derivatives markets increases the probability of forced sell-offs during volatility spikes. - Weak Spot Stickiness
Short-term rallies have repeatedly failed to convert into long-term spot accumulation.
Absent sustained buying, reflexive downside momentum can expand.
IV. The Real Question: Will Capital Stay?
Markets can rebound quickly. That is not new. What matters is durability.
In 2024 and 2025, much of Bitcoin’s upside was driven by ETF-related inflows and institutional portfolio rebalancing. However, temporary inflows differ fundamentally from structural allocation shifts.
The core issue in 2026 is not whether money enters crypto—but whether it stays.
Capital that rotates quickly amplifies volatility.
Capital that anchors reduces volatility and builds trend.
V. The Key Indicator: Coinbase Premium Index
The single most important real-time indicator to monitor is the Coinbase Premium Index.
This index measures the price difference between Bitcoin on Coinbase (USD-denominated) and major offshore exchanges.
- Positive Premium: Strong U.S. spot demand, often institutional.
- Negative Premium: Offshore selling pressure dominating U.S. buying.
In range markets, the premium frequently oscillates around zero. However, sustained positive readings signal durable U.S. accumulation.
Below is a conceptual visualization of the Premium’s role.
[“Coinbase Premium vs Bitcoin Price Relationship” – A two-axis chart showing BTC price trend alongside Premium shifts, highlighting sustained positive phases preceding uptrends.]
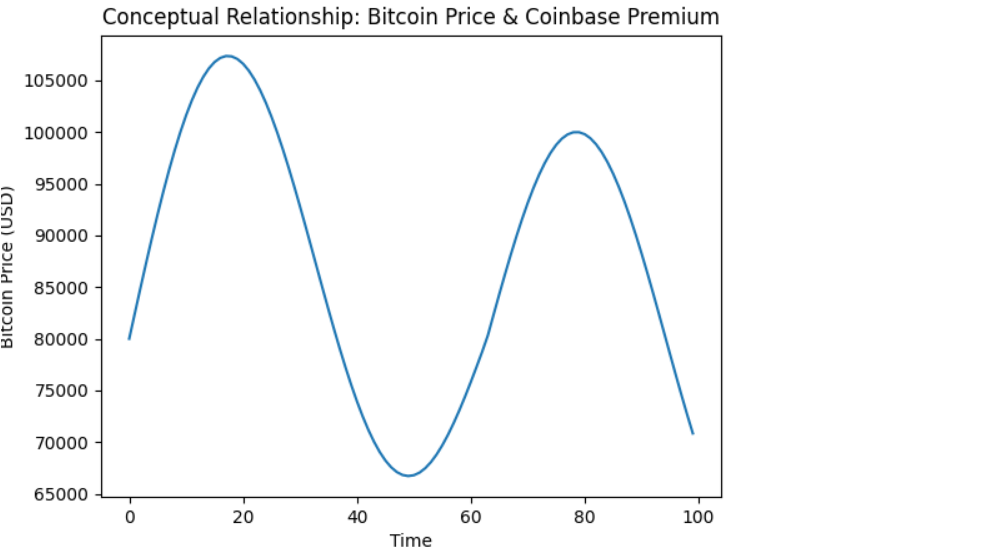
VI. Why Premium Matters More Than Price
Price is the outcome. Premium is the cause.
A rally without premium expansion is vulnerable.
A premium expansion without immediate price breakout can signal silent accumulation.
Historically, major bull legs have been preceded by:
- Sustained positive Coinbase Premium
- Stable ETF net inflows
- Reduced exchange balances
- Increasing long-term holder supply
Absent these, rallies fade.
VII. On-Chain Context: Beyond the Premium
Other on-chain indicators help contextualize the cycle:
1. ETF Flow Proxy Indicators
Spot ETF inflows indirectly reflect institutional participation. Stagnant or negative flows imply weakening absorption capacity.
2. Exchange Balances
Declining exchange balances typically support bullish structural supply tightening. Current data suggests stabilization rather than aggressive decline.
3. Long-Term Holder Supply
Strong markets show increasing LTH supply. Recent data indicates mixed signals—profit-taking has slowed but accumulation remains selective.
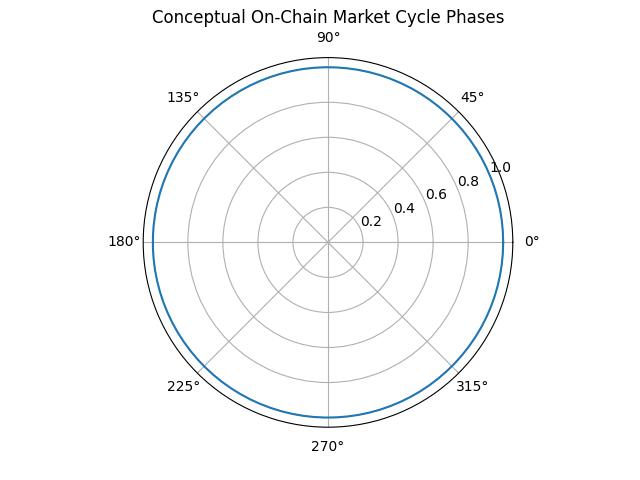
Below is a simplified on-chain cycle model.
[“On-Chain Cycle Phases Diagram” – Showing Distribution Phase, Deleveraging Phase, Accumulation Phase, Expansion Phase in circular model.]
VIII. Macro Backdrop: Why This Is Not 2022
Unlike the 2022 collapse:
- The banking system is stable.
- Inflation has moderated.
- Policy uncertainty exists but systemic stress is absent.
- Corporate credit spreads are contained.
This distinction matters. Crypto weakness is not currently part of a global financial breakdown.
It is more a function of internal market mechanics.
IX. Implications for Investors Seeking New Assets and Yield
For readers seeking:
- New crypto assets
- Yield opportunities
- Practical blockchain use cases
The current environment suggests caution and selectivity.
1. Capital Preservation First
High-beta altcoins remain vulnerable if Bitcoin retests lower levels.
2. Watch Stablecoin Growth
Stablecoin supply expansion often precedes renewed risk appetite.
3. Infrastructure Tokens Over Narrative Tokens
Projects tied to real-world usage—layer-2 scaling, modular infrastructure, tokenized real-world assets—may outperform speculative meme cycles.
4. Yield Strategies Must Be Risk-Aware
DeFi yields remain attractive but counterparty and smart contract risk must be priced conservatively.
X. Technical Structure: Range Compression or Breakdown?
Bitcoin currently exhibits range compression characteristics.
Below is a simplified conceptual chart.
[“2026 Bitcoin Range Structure” – Horizontal support near $80,000, resistance near $120,000, with potential breakdown arrow toward $50,000.]
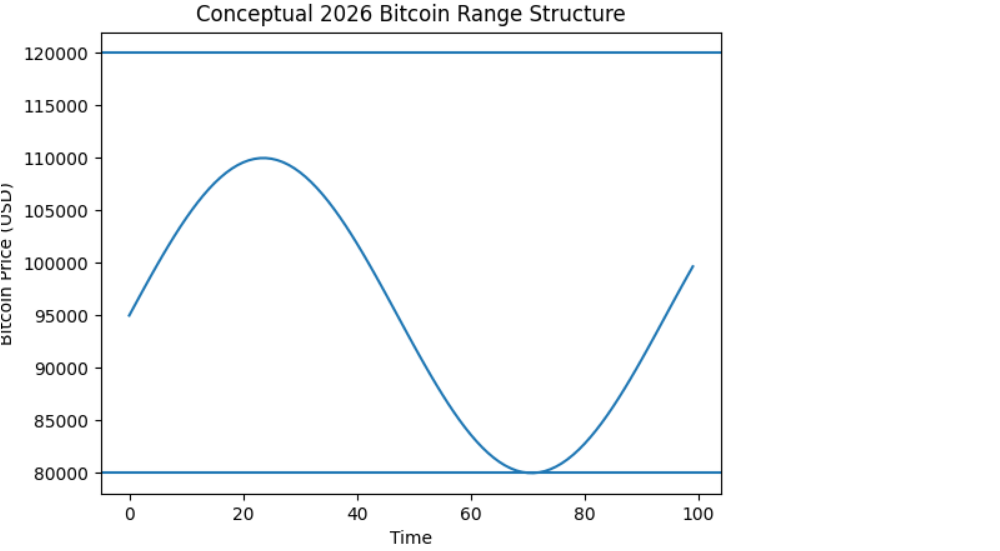
If support fails with negative premium and ETF outflows, deeper retracement risk increases.
If premium turns sustainably positive and ETF inflows stabilize, the range can resolve upward.
XI. The Transition Trigger
The market’s turning point will likely not be a headline.
It will be:
- Sustained positive Coinbase Premium
- Consecutive net ETF inflow days
- Reduced liquidation volatility
- Stable derivatives funding rates
The structural pivot will appear first in flow data.
XII. Final Assessment: 2026 Is a Flow-Driven Year
The defining feature of 2026 so far is this:
Price is secondary. Flow quality is primary.
The market sits between Scenario A and B.
Downside risk to $50,000 is not dismissed.
Upside recovery requires sustained U.S. spot demand.
Until Coinbase Premium turns durably positive, rallies remain tactical—not structural.
For disciplined investors, this is a year of monitoring, positioning, and patience.
For speculative traders, volatility remains abundant.
For long-term allocators, the turning point will not be identified by price headlines—but by capital commitment.


