Main Points :
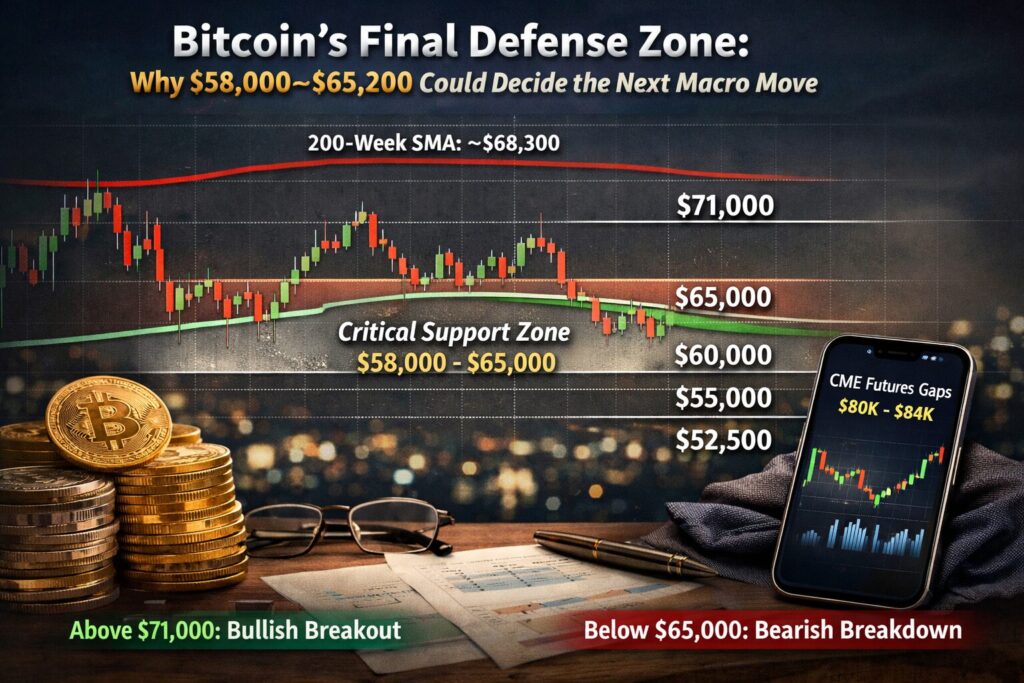
- $58,000–$65,000 is emerging as Bitcoin’s critical macro defense zone.
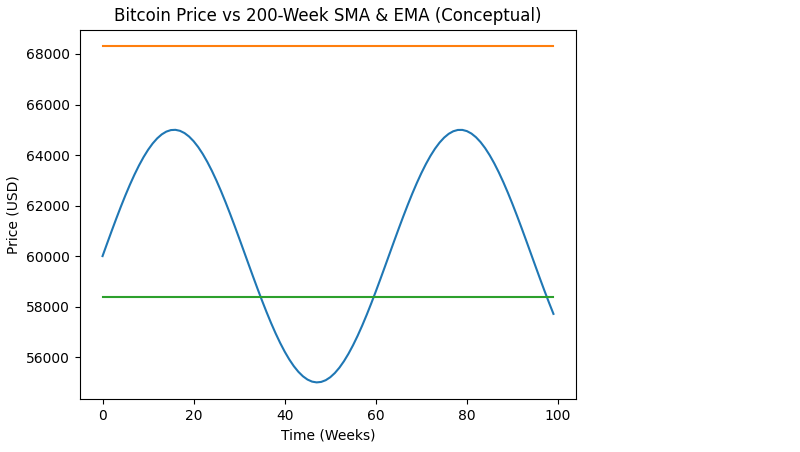
- Price is currently trading between the 200-week SMA (~$68,300) and 200-week EMA (~$58,400).
- Historically, major cycle bottoms often form between these two long-term moving averages.
- A daily close above $71,000 could trigger renewed bullish momentum.
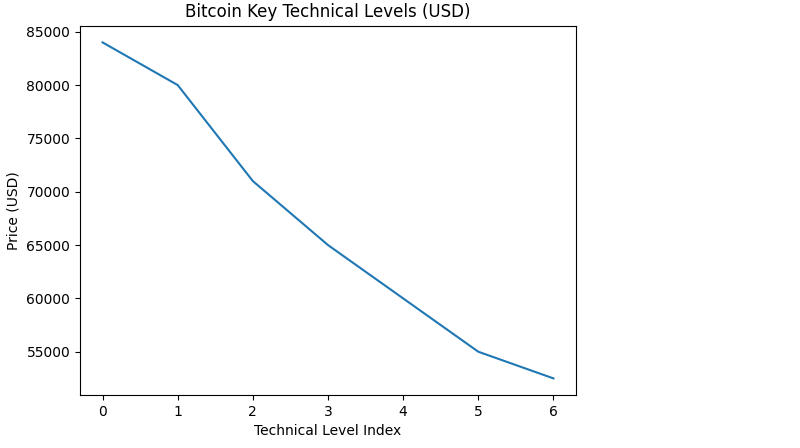
- A breakdown below $65,000 increases the probability of revisiting $60,000, then potentially $55,000 or even $52,500.
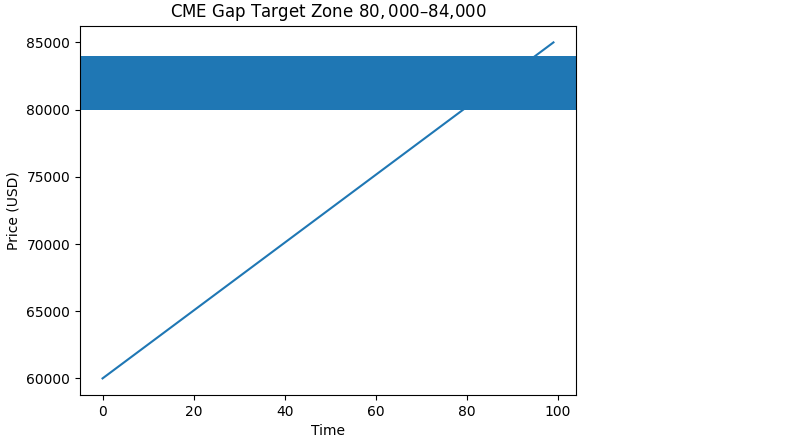
- CME futures gaps around $80,000–$84,000 remain upside magnets.
- On-chain cost-basis data shows strong support in the $63,000–$65,000 range.
- The macro structure remains undecided, but volatility compression suggests a decisive move is approaching.
1. The 200-Week Battle: Where Macro Trends Are Decided
Bitcoin is currently caught between two of the most important long-term technical indicators in its history:
- 200-week Simple Moving Average (SMA): ~$68,300
- 200-week Exponential Moving Average (EMA): ~$58,400
Historically, major Bitcoin cycle bottoms have often formed between these two levels. During previous bear market capitulations, price briefly wicked below the 200-week moving average before reclaiming it and building a long-term base.
The present structure is remarkably similar.
Bitcoin has recorded two consecutive weekly closes above the 200-week EMA (~$58,400), which is technically constructive. However, this does not automatically confirm a new bullish cycle. If upward momentum fails to materialize, price may gradually slip below the 200-week EMA over time, reopening the door to deeper retracement.
For investors seeking asymmetry, this zone is not merely a price range — it is a macro structural inflection point.
2. Why $65,000 Is the Immediate Line in the Sand
After rejecting near $72,000, Bitcoin found short-term support at approximately $65,000.
On-chain cost basis heatmaps show that a large cluster of long-term holders accumulated around $63,000–$65,000, representing roughly 372,000 BTC. This creates a significant structural support band.
If price holds above $65,000:
- Market structure remains constructive.
- Accumulation narrative stays intact.
- Probability of reclaiming $71,000 increases.
If price breaks decisively below $65,000:
- Momentum shifts toward bears.
- $60,000 becomes the next major support.
- A breakdown of $60,000 could accelerate decline toward $55,000 (realized price region).
- Extreme downside extension could test $52,500.
From a risk-management perspective, this is a classic high-volatility compression phase before expansion.
3. The $71,000 Trigger and the Path Toward $80,000–$84,000
On the bullish side, analysts emphasize $71,000 as the breakout trigger.
A daily close above $71,000 would:
- Break recent lower-high structure.
- Shift short-term trend bias upward.
- Likely initiate momentum-driven buying.
Beyond that, attention turns to the CME futures gap between $80,000 and $84,000.
Historically, Bitcoin has shown a high tendency to fill CME gaps. Since mid-2025, 9 out of 10 major gaps have been filled. This statistical behavior makes the $80,000–$84,000 zone a magnet should bullish momentum resume.
For forward-looking investors, this creates a compelling asymmetric setup:
- Downside risk: ~$5,000–$10,000
- Upside potential: ~$15,000–$20,000+
4. On-Chain Perspective: The Realized Price Floor Near $55,000
On-chain analytics suggest that if $63,000–$65,000 fails, the next logical magnet is the realized price around $55,000.
The realized price represents the average cost basis of all coins in circulation. Historically:
- During bull cycles, realized price acts as macro support.
- During deep bear cycles, price can dip below it briefly.
If Bitcoin were to revisit $55,000, it would not automatically imply a new bear market — but it would significantly reset leverage and speculative positioning.
For long-term allocators, realized price regions often represent strategic accumulation zones.
5. Macro Environment: Why This Time Is Structurally Different
Unlike previous cycles, the current Bitcoin structure exists within:
- Institutional ETF participation
- Increased corporate treasury adoption
- Broader derivatives market depth
- Tighter macro liquidity cycles
Spot ETF flows have shown periodic accumulation despite price volatility. Institutional participants tend to scale in gradually rather than chase breakouts, which may explain the current compression phase.
At the same time, macro risk factors — including U.S. interest rate policy and global liquidity tightening — continue to influence volatility.
This creates a unique dual dynamic:
- Structural long-term demand
- Short-term macro uncertainty
6. Strategic Implications for Crypto Investors
For readers seeking new digital asset opportunities and yield generation, this phase offers multiple strategic angles:
A. Spot Accumulation Strategy
Scaling into the $60,000–$65,000 region with strict invalidation below $55,000.
B. Volatility Trading
Given compression between 200W SMA and EMA, implied volatility strategies may outperform directional bets.
C. Relative Strength Rotation
If Bitcoin holds support, capital may rotate into high-beta assets such as ETH, SOL, and emerging L2 ecosystems.
D. Treasury Allocation Insight
For fintech operators and crypto businesses, this zone provides insight into capital allocation timing and hedge calibration.
7. Scenario Framework
Bullish Scenario
- Hold $65,000
- Reclaim $71,000
- Momentum toward $80,000–$84,000 CME gap
Neutral Consolidation
- Range between $60,000–$71,000
- Volatility compression continues
- Derivatives funding resets
Bearish Scenario
- Lose $65,000
- Break $60,000
- Test $55,000 realized price
- Possible overshoot to $52,500
Conclusion: The Market Is Deciding Its Next Multi-Month Direction
Bitcoin is currently positioned at one of the most technically significant junctures of this cycle. The $58,000–$65,000 range represents more than support — it represents structural integrity.
If bulls defend this region and reclaim $71,000, the path toward $80,000–$84,000 becomes increasingly probable.
If bears force a breakdown below $65,000, volatility could accelerate downward toward $55,000.
For investors searching for asymmetric opportunities, this is not a time for emotional reaction — it is a time for structured positioning.
The market is compressing.
Expansion is coming.
The only question is direction.