Main Points :
- Bitcoin could recover to $150,000 by year-end if key structural conditions align.
- The 200-week simple moving average (200W SMA) remains the defining long-term support.
- Sustained upside requires renewed capital inflows from new investors, including ETF flows.
- A decline in Tether (USDT) dominance would signal capital rotation back into risk assets.
- Quantum computing fears appear overstated in the near-to-mid term.
- Potential Federal Reserve rate cuts could reignite global liquidity and risk appetite.
1. A $150,000 Target: Why Bernstein Sees Recovery Ahead
According to Bernstein’s latest market outlook, Bitcoin could recover from its current corrective phase and reach $150,000 before the end of the year. This projection is not built on speculative hype but on structural historical patterns, macro liquidity expectations, and on-chain behavioral data.
At current levels (for analytical purposes assuming approximately $60,000–$70,000), a move to $150,000 would imply a 115%–150% upside. Such moves are not unprecedented in Bitcoin’s history. In prior cycles—2015–2017 and 2018–2021—Bitcoin posted multi-fold returns after holding critical long-term support structures.
The thesis is not that Bitcoin rises in a straight line. Rather, the argument is that once structural supports hold and liquidity turns favorable, Bitcoin tends to reprice rapidly due to its reflexive supply-demand dynamics.
For investors seeking new digital asset opportunities, the key takeaway is this: the market is once again testing the foundational indicators that historically preceded major expansion phases.
2. The 200-Week Moving Average: Bitcoin’s Structural Spine
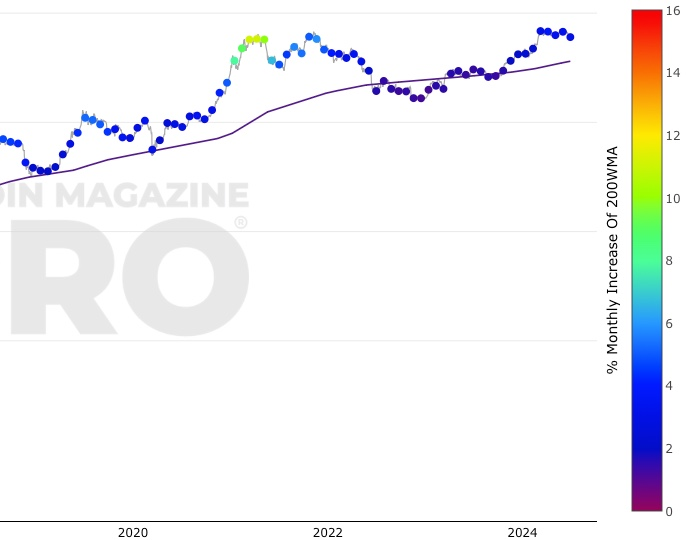
The 200-week simple moving average (200W SMA) has historically functioned as Bitcoin’s ultimate structural support.
In 2015 and 2018, Bitcoin bottomed near the 200W SMA before transitioning into multi-year bull markets. Even during the 2022 bear market, when price temporarily broke below the line, the deviation was short-lived.
Why is this line so important?
- It represents long-term cost basis across cycles.
- It reflects multi-year holder conviction.
- It historically absorbs capitulation selling.
If Bitcoin remains above the 200W SMA, the probability of a prolonged 2022-style liquidation cascade diminishes significantly. Structurally, it signals transition rather than collapse.
For capital allocators, this line functions almost like a macro risk gauge. As long as it holds, Bitcoin behaves less like a speculative bubble and more like an emerging macro asset class consolidating for expansion.
3. The Missing Ingredient: Fresh Capital Inflows
No bull market survives without new buyers.
As of February, wallets belonging to first-time holders and short-term holders recorded cumulative outflows of approximately $2.7 billion—the highest level since 2022. This suggests marginal buyers have stepped back.
Healthy bull markets exhibit:
- Dip-buying by new entrants
- Sustained positive net inflows
- Expanding participation
Currently, price movements appear driven more by internal rotation—capital shifting between holders—rather than fresh liquidity entering the system.
However, early signs of reversal are emerging. Spot Bitcoin ETF flows recently turned positive again. Institutional vehicles have become a structural bridge between traditional capital markets and crypto.
If ETF inflows sustain and retail participation reaccelerates, the liquidity profile could resemble early 2020—just before Bitcoin entered exponential price discovery.
For investors looking for emerging revenue opportunities, tracking ETF flow momentum may prove more important than short-term price volatility.
4. Tether Dominance: The Capital Rotation Signal
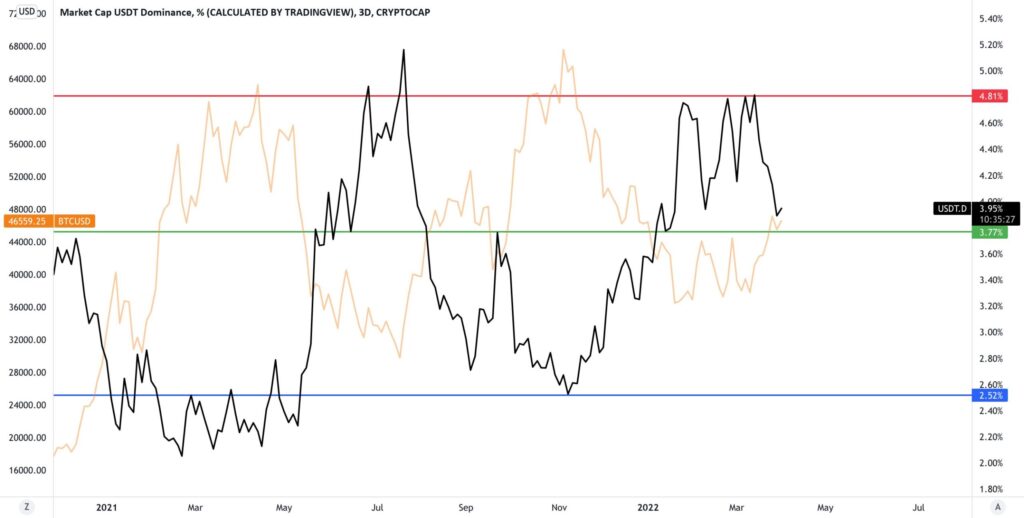
Tether (USDT) dominance has recently risen toward the 8.5%–9.0% resistance zone of total crypto market capitalization.
This matters because USDT dominance reflects defensive positioning.
- Rising USDT dominance = capital retreating to stablecoins.
- Falling USDT dominance = capital redeploying into risk assets.
Since November 2022, every rejection from the 8%–9% zone coincided with powerful Bitcoin rallies:
- One instance led to a 76% increase over 140 days.
- Another preceded a 169% increase over 180 days.
Conversely, when USDT dominance broke above resistance in May 2022, Bitcoin fell approximately 45%.
This inverse relationship acts as a capital flow thermometer.
For Bitcoin to begin a sustained bull phase toward $150,000, USDT dominance must decline decisively—indicating risk capital is rotating back into BTC and broader crypto markets.
5. Quantum Computing: A Distant Threat, Not an Immediate Catalyst
One recurring concern in crypto discourse is quantum computing.
Some estimates suggest up to 25% of Bitcoin addresses could theoretically be vulnerable if quantum computers advanced dramatically. However, multiple experts have dismissed this as a near-term systemic risk.
In November 2025, cryptographer and Blockstream CEO Adam Back stated that meaningful quantum risk to Bitcoin is likely 20–40 years away. By then, protocol upgrades would likely enable quantum-resistant cryptographic transitions.
Bitcoin Optech has also emphasized that short-term vulnerabilities are limited mainly to reused addresses—not the network as a whole.
Major players such as Coinbase and MicroStrategy have reportedly consulted experts to outline security roadmaps.
For forward-looking investors, quantum computing currently represents narrative volatility rather than structural risk. It may cause temporary fear cycles—but not systemic breakdown.
6. Federal Reserve Policy: The Liquidity Catalyst
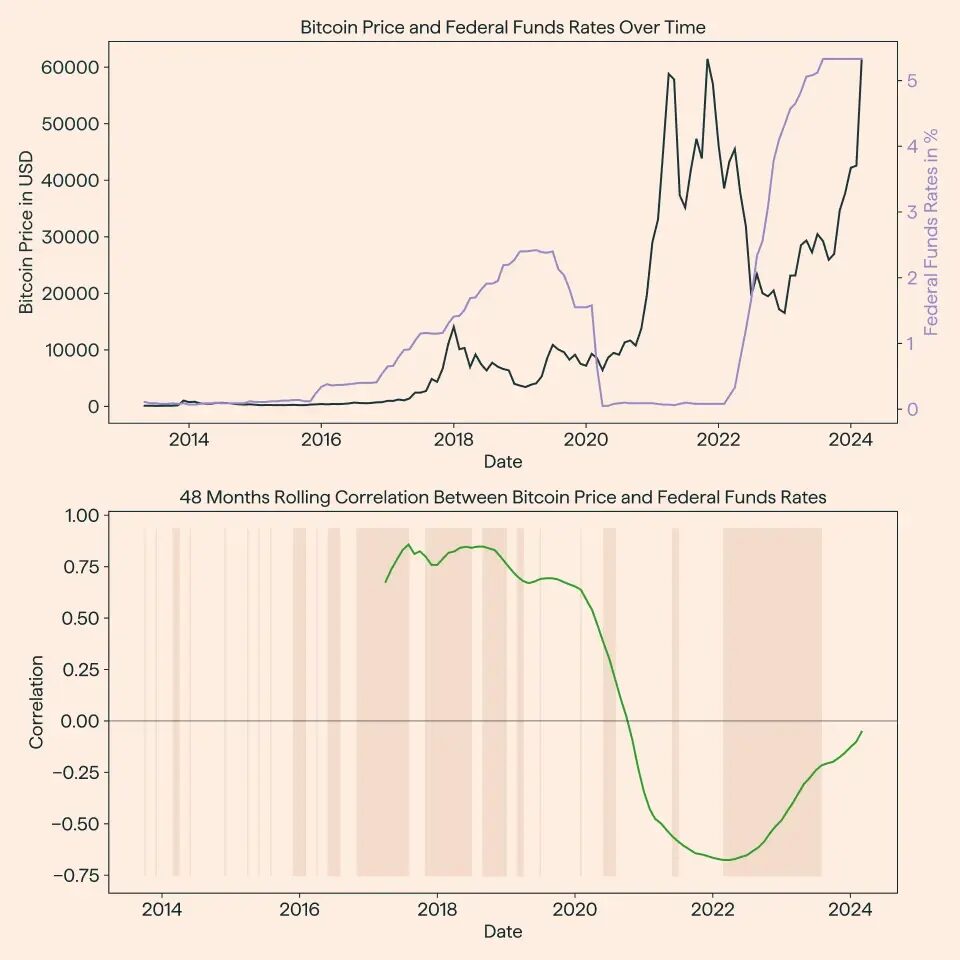
Perhaps the most powerful variable is macro liquidity.
If the Federal Reserve implements at least two rate cuts in 2026—as futures markets have priced—risk assets could benefit significantly. Some strategists even anticipate the possibility of three cuts.
Lower interest rates reduce the attractiveness of yield-bearing instruments like U.S. Treasuries. Investors seeking higher returns often rotate into equities and crypto.
Bitcoin’s strongest rallies historically align with:
- Expanding global liquidity
- Falling real rates
- Weakening dollar cycles
If rate cuts coincide with ETF inflows and declining USDT dominance, the liquidity trifecta could form.
For yield-seeking crypto investors, this macro backdrop would not only benefit Bitcoin but also high-beta altcoins, DeFi protocols, and tokenized real-world asset platforms.
Conclusion: Conditions, Not Hope, Define the Path to $150,000
Bitcoin reaching $150,000 is not guaranteed—but it is structurally plausible.
The path depends on:
- Holding the 200-week SMA
- Sustained new capital inflows
- Declining USDT dominance
- Diminishing quantum fears
- Federal Reserve rate cuts
If these variables align, Bitcoin may not simply recover—it may enter another price discovery phase.
For readers seeking new digital assets and practical blockchain opportunities, the bigger picture extends beyond price:
- Institutional infrastructure is maturing.
- ETF pipelines are operational.
- Security roadmaps are advancing.
- Macro liquidity may soon turn supportive.
In prior cycles, skepticism dominated just before expansion.
History does not repeat perfectly—but in Bitcoin’s case, structural rhythms often rhyme.
If capital rotation resumes and liquidity expands, $150,000 may not represent the ceiling of the next cycle—but the midpoint.