
Key Takeaways :
- Bitcoin’s recent rebound does not necessarily signal the end of the current bearish phase.
- Several traders and analysts are comparing the current structure to the 2022 bear market.
- Long-term moving averages and the cost basis of U.S. spot Bitcoin ETFs are becoming critical reference points.
- If history partially repeats, Bitcoin’s “true bottom” could form around or even below $50,000.
- However, market structure, ETF flows, and macro conditions differ materially from 2022, suggesting outcomes may diverge.
A Rebound That Fails to Convince the Market
Bitcoin (BTC) staged a notable rebound over the weekend, rising as much as 3% and briefly reclaiming levels above $71,000 after marking its lowest price in roughly 15 months. On the surface, such a recovery might appear to signal renewed bullish momentum. Yet beneath the price action, skepticism remains widespread among traders and analysts who question whether this bounce represents anything more than a temporary relief rally.
Historically, sharp rebounds are not uncommon during extended bearish phases. In many cases, they function as volatility-driven corrections rather than trend reversals. The current recovery has therefore done little to alter the broader debate: has Bitcoin already found its cycle low, or is the market still in the process of discovering a deeper bottom?
The Shadow of 2022: Déjà Vu for Bitcoin Traders
Independent analyst Filbfilb has drawn attention to the striking similarities between Bitcoin’s current price structure and the 2022 bear market. By overlaying current price action with historical charts, Filbfilb highlights how Bitcoin appears to be struggling beneath key long-term resistance levels, most notably the five-week exponential moving average (EMA), currently situated around $95,300.
Rather than framing the situation optimistically, Filbfilb has cautioned against premature bullishness, arguing that the market is attempting to “look better than it really is.” This sentiment is echoed by other technical analysts who see parallels in momentum loss, volatility spikes, and failed reclaim attempts of major moving averages. The Absence of Capitulation
One recurring theme in bearish-cycle analysis is capitulation—the point at which sellers exhaust themselves, often marked by panic selling and extreme negative sentiment. According to trader Bitbull, this defining moment has not yet occurred in the current cycle.
Bitbull argues that Bitcoin’s final capitulation phase is still ahead and that the true bottom could emerge below $50,000. In such a scenario, a significant portion of market participants—particularly recent entrants via exchange-traded funds—would be holding unrealized losses.
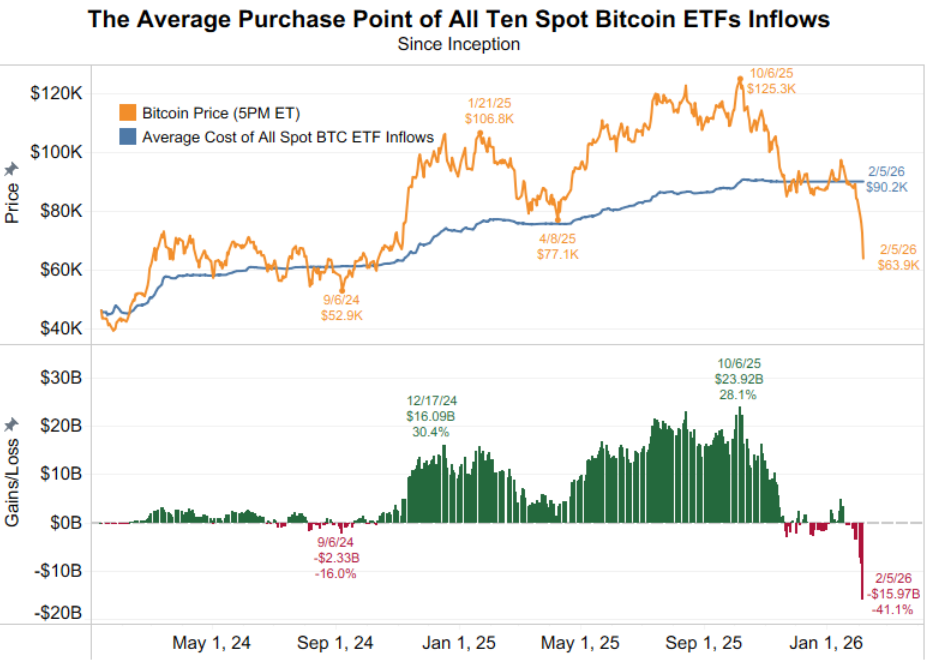
This view is reinforced by on-chain data from Checkonchain, which estimates that the average acquisition cost for U.S. spot Bitcoin ETF holders currently stands at approximately $82,000. A move toward $50,000 would therefore place the majority of ETF investors deep underwater, a condition historically associated with market capitulation and long-term bottom formation.
“Bitcoin Price vs. U.S. Spot Bitcoin ETF Average Cost Basis”
Long-Term Moving Averages as Structural Anchors
Another widely followed framework focuses on Bitcoin’s 200-week simple moving average (SMA) and 200-week exponential moving average (EMA). These indicators have historically served as long-term support zones during bear markets and accumulation phases.
At present, these two moving averages form a broad support band between approximately $58,000 and $68,000. Bitcoin’s recent price action has interacted with this zone in a manner that closely resembles prior bear-market behavior.
Market analyst Caleb Franzen, founder of Cubic Analytics, recently revisited this pattern, recalling events from mid-2022. At that time, Bitcoin initially rebounded after testing the 200-week moving average “cloud,” producing long lower wicks and closing above weekly midpoints. Optimism briefly returned, with many interpreting the move as confirmation of a durable bottom.
However, the relief proved short-lived. Within weeks, Bitcoin revisited the same zone, failed to sustain support, and ultimately broke below the 200-week averages, triggering a deeper drawdown.
Franzen notes that today’s market is once again witnessing the “first retest” of this long-term moving average cloud, complete with similar wick structures. While not predictive on its own, the resemblance raises caution flags for traders relying solely on historical support levels.
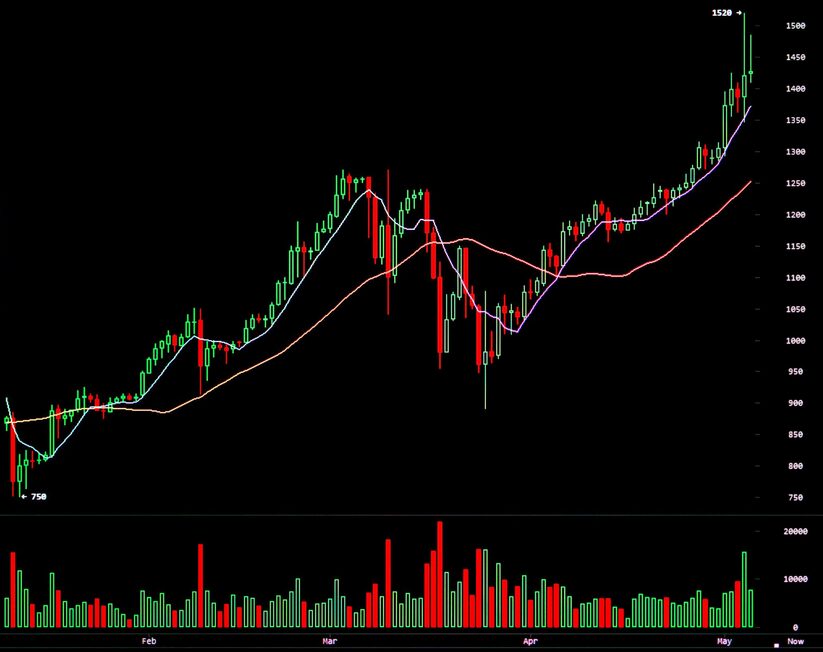
“Bitcoin Weekly Chart with 200-Week SMA and EMA”
Why This Cycle Is Not a Carbon Copy
Despite these parallels, analysts are careful to emphasize that the current market is not an exact replay of 2022. Structural differences are substantial. The presence of regulated U.S. spot Bitcoin ETFs introduces a new layer of institutional participation that did not exist during previous cycles. These products alter liquidity dynamics, investor behavior, and potentially the psychology of drawdowns.
Macro conditions also differ. In 2022, Bitcoin faced aggressive monetary tightening amid rising inflation and collapsing risk appetite across global markets. While monetary policy remains restrictive today, expectations around future rate cuts and the normalization of inflation have already been partially priced into markets.
Moreover, Bitcoin’s role within the broader digital asset ecosystem has evolved. It is increasingly treated not merely as a speculative asset but as a form of digital collateral, treasury reserve, and hedge within certain institutional portfolios. These factors could dampen downside volatility—or, alternatively, delay capitulation by distributing losses more gradually.
Practical Implications for Investors and Builders
For readers seeking new crypto assets, revenue opportunities, or practical blockchain applications, the implications are nuanced. A potential drawdown toward $50,000 would likely be painful in the short term but could present strategic accumulation opportunities for long-term investors with disciplined risk management.
For builders and operators, prolonged bearish conditions historically coincide with increased focus on infrastructure, efficiency, and real-world utility. Many of today’s most durable blockchain businesses were built during periods of pessimism rather than euphoria. A slower market often filters out speculative noise, redirecting attention toward sustainable use cases such as payments, tokenization, settlement infrastructure, and compliance-ready financial rails.
Market Psychology: Fear, Time, and Opportunity
One lesson repeated across Bitcoin’s history is that bottoms are rarely formed at moments of intellectual consensus. Instead, they emerge when time, frustration, and unrealized losses converge. ETF investors holding underwater positions, miners operating near breakeven, and traders fatigued by volatility all contribute to this psychological environment.
Whether Bitcoin ultimately revisits $50,000 or stabilizes higher, the process may take longer than many expect. Sideways consolidation, false breakouts, and sharp countertrend rallies are all characteristic of late-stage bear markets.
Conclusion: Between History and Uncertainty
Bitcoin’s recent rebound has sparked debate, but it has not resolved the central question of whether the bear market has truly ended. Comparisons to 2022 suggest that further downside remains plausible, particularly if the market seeks a deeper capitulation phase around $50,000.
At the same time, the current cycle is shaped by new forces—spot ETFs, institutional exposure, and evolving macro narratives—that could alter historical patterns. As Caleb Franzen succinctly observes, “In reality, no one knows what comes next.”
For investors and builders alike, the prudent approach lies not in predicting exact price levels, but in understanding structure, managing risk, and preparing for multiple outcomes. Whether the bottom is already in or still ahead, the next phase of Bitcoin’s evolution will be shaped as much by utility and resilience as by price alone.