Main Points :
- Ethereum (ETH) has fallen below $2,000, marking a drawdown of over 60% from its all-time high near $4,950.
- On-chain data indicates a structural shift: large holders (“whales”) are accumulating, while small to mid-sized investors are capitulating.
- ETH is trading below the realized price of all major holder cohorts, a condition historically associated with stress-driven selling.
- Exchange inflows—particularly to Binance—have surged to levels not seen since 2022, reinforcing near-term bearish pressure.
- While fundamentals and long-term use cases remain intact, the data suggests Ethereum has entered a challenging bearish phase that could persist for some time.
1. Ethereum’s Price Collapse and the Psychological $2,000 Level
Ethereum’s drop below $2,000 represents more than a simple technical breakdown. On Thursday, ETH fell to approximately $1,927, its lowest level of the year, extending a prolonged decline from the all-time high of around $4,950 recorded during the previous bull cycle. This places Ethereum more than 60% below its peak, a magnitude of decline that historically tests the conviction of even long-term holders.
Psychologically, the $2,000 level has functioned as a key support zone for Ethereum since 2021. It is a price area where institutional narratives, retail expectations, and cost-basis anchoring converge. A decisive break below this threshold often shifts market sentiment from “correction” to “bear market,” particularly when supported by corroborating on-chain and exchange data.
For investors searching for new crypto assets or the next sustainable revenue opportunity, such moments are critical. They separate short-term speculation from longer-term structural positioning. To understand whether Ethereum’s decline represents a temporary shakeout or the beginning of a deeper bearish cycle, on-chain behavior provides essential clues.
2. What On-Chain Data Reveals About Investor Behavior
On-chain metrics allow analysts to observe how different classes of Ethereum holders behave during periods of stress. By categorizing wallets according to ETH balance size, it becomes possible to identify who is absorbing supply and who is exiting the market.
According to data from CryptoQuant, wallet cohorts have shown sharply diverging behavior over the past five months.
As of mid-August, wallets holding:
- 100–1,000 ETH collectively held approximately 9.79 million ETH
- 1,000–10,000 ETH held around 14.51 million ETH
- 10,000–100,000 ETH held roughly 17.18 million ETH
- More than 100,000 ETH held about 2.75 million ETH
However, by Wednesday of this week, the distribution had changed markedly. Holdings in the 100–1,000 ETH group dropped to around 8.32 million ETH, while the 1,000–10,000 ETH cohort declined to roughly 12.26 million ETH. In contrast, wallets holding 10,000–100,000 ETH increased their holdings to nearly 19.77 million ETH, and the largest wallets—those above 100,000 ETH—expanded to about 3.68 million ETH.
[“Ethereum Holdings by Wallet Size (5-Month Change)”]
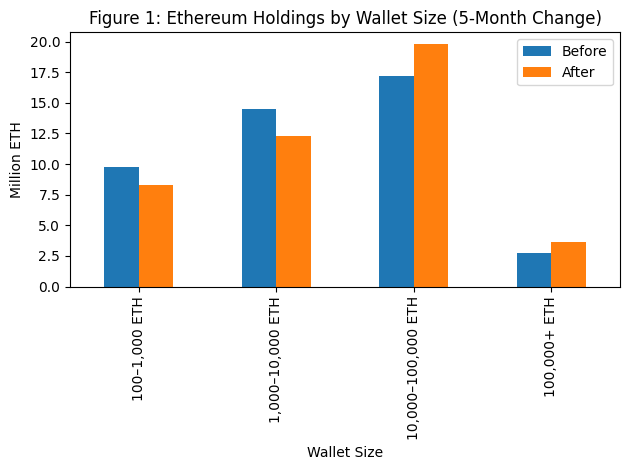
This divergence suggests a classic late-cycle dynamic: smaller and mid-sized investors are selling into weakness, while whales and large institutions are accumulating at depressed prices. Historically, such behavior often precedes long-term bottoms—but it does not preclude further downside in the short to medium term.
3. Realized Price: Why ETH Is Trading in a Stress Zone
One of the most telling indicators in this cycle is Ethereum’s position relative to its realized price. The realized price reflects the average cost basis at which holders last moved their ETH. When the spot price falls below realized price levels, it implies that a majority of holders are sitting on unrealized losses.
Currently, Ethereum is trading below the realized price for all major holder cohorts:
- Wallets holding over 100,000 ETH have a realized price near $2,120
- Wallets holding 100–1,000 ETH cluster around a realized price of roughly $2,690
- The overall market’s realized price sits near $2,630
ETH briefly closed below this aggregate realized price over the weekend, a condition that has historically been associated with capitulation events and stress-driven selling rather than orderly profit-taking.
[“Ethereum Spot Price vs. Realized Price”]
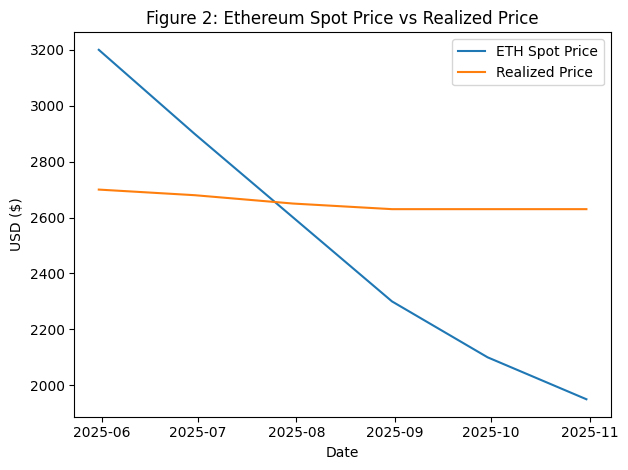
For investors focused on blockchain’s practical use rather than short-term price action, this distinction matters. Trading below realized price often marks periods when weaker hands exit and stronger hands accumulate—but timing such transitions requires patience and risk tolerance.
4. Exchange Inflows and the Weight of Selling Pressure
Another critical signal reinforcing the bearish outlook is the sharp increase in Ethereum inflows to centralized exchanges. On Wednesday alone, approximately 1.63 million ETH flowed into Binance, marking the highest daily inflow since 2022.
Large exchange inflows typically indicate preparation for selling, collateral adjustments, or derivatives positioning. While not every deposited ETH is immediately sold, the scale of this movement strongly suggests elevated intent to reduce exposure.
[“Ethereum Inflows to Binance (2022–Present)”]
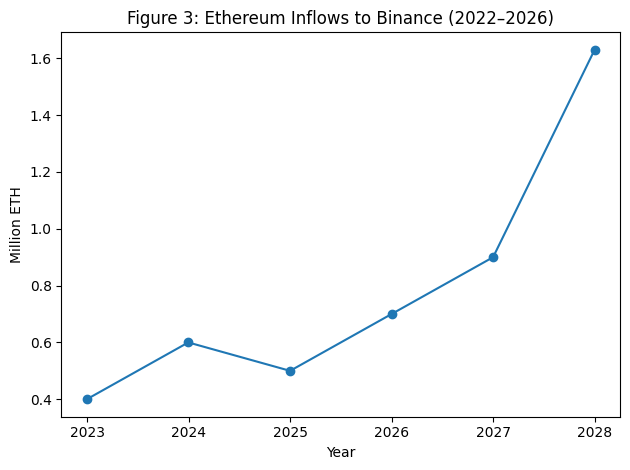
Market microstructure data supports this interpretation. According to crypto analyst observations, the ETH taker buy/sell ratio on Binance has remained around 0.94, below the neutral level of 1. Moreover, both the 30-day and 50-day moving averages of this ratio remain under 1, indicating that selling pressure is not a short-lived anomaly but a persistent trend.
5. Is This the Beginning of a Broader Altcoin Bear Market?
Several analysts argue that Ethereum’s weakness may signal the start of a broader “altcoin bear season.” Historically, ETH functions as a bellwether for the altcoin market. When Ethereum underperforms Bitcoin and loses key support levels, capital often retreats from smaller, higher-risk assets.
From a market-structure perspective, this environment favors:
- Cash-flow–generating blockchain projects
- Infrastructure protocols with real-world adoption
- Assets linked to payments, settlement, and compliance-friendly use cases
Speculative tokens without clear utility or revenue models tend to suffer disproportionately during such phases.
For builders and investors focused on blockchain’s practical application—such as payments, settlement layers, tokenized assets, or compliance-aligned financial infrastructure—bear markets often present opportunities rather than threats. Development continues, competition thins, and valuations reset to levels that better reflect real usage rather than hype.
6. Long-Term Outlook: Accumulation, Patience, and Utility
Despite the bearish signals, Ethereum’s long-term fundamentals remain largely unchanged. The network continues to dominate decentralized finance (DeFi), non-fungible tokens (NFTs), and smart contract infrastructure. Layer-2 scaling solutions, enterprise adoption experiments, and real-world asset tokenization all continue to build on Ethereum’s base layer.
The current data suggests that large holders recognize this long-term value, even as short-term sentiment deteriorates. For investors searching for the “next yield source,” this distinction is critical. Yield in crypto increasingly comes not from price appreciation alone, but from staking, infrastructure participation, and integration with real economic activity.
However, history also suggests that such accumulation phases can last months, not weeks. Price recovery above $2,000 is not guaranteed in the near term, and further volatility should be expected.
Conclusion: A Market Under Stress, Not a Market Without Value
Ethereum’s fall below $2,000 marks a significant psychological and structural moment for the crypto market. On-chain data paints a picture of stress: smaller investors exiting, realized prices breached, and exchange inflows surging. At the same time, large holders are quietly accumulating, signaling confidence in Ethereum’s long-term relevance.
For readers seeking new crypto assets, future revenue opportunities, or practical blockchain use cases, the message is nuanced. This is not an environment for blind speculation—but it is a period rich in signals. Ethereum appears to be entering a true bearish phase, one that tests conviction and rewards discipline rather than momentum.
Understanding these dynamics—and positioning accordingly—will be essential for navigating the next chapter of the crypto market.