Key Takeaways :
- Bitcoin fell more than 13% in four days, breaking below the psychologically and historically important $69,000 level from the 2021 cycle peak.
- Over $10 billion in futures open interest was wiped out in a week, signaling aggressive deleveraging rather than slow distribution.
- On-chain cost basis data and long-term technical indicators converge around the $58,000–$69,000 zone as a critical demand region.
- Extreme oversold signals across RSI and NUPL suggest selling pressure may be nearing exhaustion, even if an immediate rebound does not occur.
- Faster sentiment resets compared to past cycles may compress the duration of capitulation, creating asymmetric opportunities for long-term participants.
1. A Sharp Breakdown: What Actually Happened in the Last Four Days
Bitcoin’s decline from approximately $79,300 to a low near $63,800 within just four days represents one of the most aggressive short-term drawdowns of the current cycle. The speed of the move, rather than the absolute percentage, is what alarmed market participants.
For many investors, the $69,000 level carried symbolic and structural importance. It marked the all-time high of the 2021 bull market and had long been viewed as a “cycle support” if prices were ever to revisit it. The clean break below this level shattered that assumption and triggered forced selling across derivatives markets.
Unlike gradual bear-market distributions, this move was characterized by cascading liquidations. As price dropped, leveraged long positions were closed en masse, accelerating downside momentum.
Bitcoin one-month price chart showing the break below $69,000
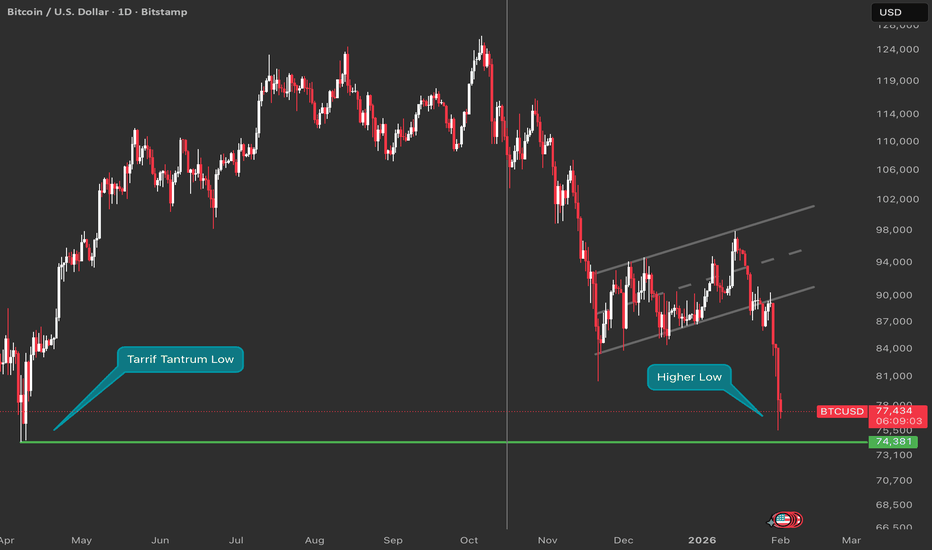
This pattern strongly suggests that the move was driven less by long-term holders exiting positions and more by short-term leverage being flushed out of the system.
2. The Futures Market Collapse: Deleveraging at Historic Scale
One of the clearest confirmations of capitulation came from futures market data. Bitcoin open interest fell by more than $10 billion over seven days, one of the steepest contractions on record.
In practical terms, this means that a significant portion of speculative positioning—particularly high-leverage longs—was forcibly removed. Historically, such rapid deleveraging events tend to mark local or intermediate bottoms, even if price continues to chop sideways afterward.
This is important for sophisticated investors because deleveraging resets risk in the system. After leverage is purged, subsequent price moves tend to be more organic and less prone to sudden liquidation cascades.
For builders and operators in the blockchain space, this also reduces systemic risk. Exchanges, lending desks, and liquidity providers operate more safely in a lower-leverage environment.
3. Why the $69,000 Level Matters More Than Psychology
The importance of $69,000 goes beyond sentiment. In previous Bitcoin cycles, former all-time highs have repeatedly acted as structural support during later corrections.
- In the 2017 cycle, Bitcoin peaked near $19,600.
- During the 2022 bear market, price found a bottom around $16,000–$19,000 before stabilizing.
This historical behavior conditioned many participants to expect a similar defense at $69,000. However, markets rarely reward consensus expectations.
The break does not invalidate the cycle thesis—but it does suggest that the market needed a deeper reset than many anticipated.
4. On-Chain Reality Check: The $58,000–$69,000 Demand Zone
On-chain cost basis analysis provides a more grounded perspective than price charts alone. Data shows a heavy concentration of Bitcoin acquisition costs between $58,000 and $69,000.
This means a large portion of current holders accumulated BTC in this range, making it a zone where both psychological and economic incentives to defend price are strong.
Notably, the lower end of this range aligns closely with the 200-week moving average, currently around $58,000. Historically, this moving average has acted as a last-resort support during deep corrections.
Bitcoin URPD (cost basis distribution) chart
From a long-term investment standpoint, this convergence of on-chain and technical signals strengthens the case that this zone represents structural value rather than random price noise.
5. Order Books and Real Buyers: Evidence of Dip Demand
Beyond historical indicators, real-time market data also shows signs of demand. Large bid clusters have been observed between $65,000 and $68,000 on major exchanges, indicating that institutional or high-net-worth buyers are stepping in during weakness.
This is a crucial distinction. In true bear markets, order books tend to thin out as buyers disappear. In the current environment, liquidity remains present, suggesting strategic accumulation rather than panic abandonment.
6. Extreme Oversold Signals: Rare Technical Conditions
Technical indicators are now flashing signals that have appeared only a handful of times in Bitcoin’s history.
The weekly Relative Strength Index (RSI) has dropped below 30, a level reached only four times previously. In those historical cases, Bitcoin averaged a 16% rebound within the following four weeks.
Weekly RSI comparison across cycles
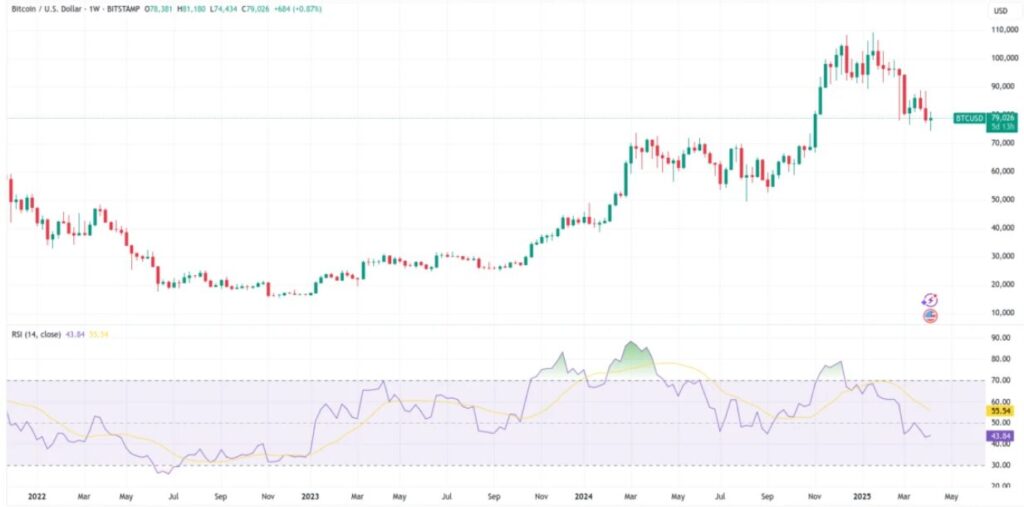
It is critical to note that RSI does not time exact bottoms. Instead, it highlights conditions where selling pressure becomes statistically unsustainable.
7. NUPL Turns Negative: Most Holders Are Underwater Again
Another key metric, Adjusted Net Unrealized Profit/Loss (NUPL), has turned negative for the first time since 2023. This indicates that the average holder is now sitting on unrealized losses.
Historically, negative NUPL phases have coincided with accumulation zones rather than distribution phases.
Adjusted NUPL across market cycles
Previous instances in 2018–2019, 2020, and 2022–2023 all preceded significant recoveries.
8. The Speed of Sentiment Collapse: A Structural Difference This Cycle
One notable difference this time is speed. The shift from optimism to fear occurred much faster than in prior cycles.
Rather than a slow grind lower, Bitcoin experienced a rapid sentiment reset. This kind of shock often shortens capitulation phases, as weak hands exit quickly and stronger hands absorb supply.
For investors seeking asymmetric opportunities, this matters. Faster capitulation can mean fewer months of stagnation and earlier transitions into accumulation-driven recoveries.
9. Implications for Investors, Builders, and Yield Seekers
For those looking beyond price speculation, this phase has broader implications:
- Investors: Dollar-cost averaging near structural demand zones historically improves long-term risk-adjusted returns.
- Yield strategists: Lower volatility after deleveraging often improves conditions for basis trades, covered strategies, and lending.
- Builders: Reduced speculative froth refocuses attention on real usage—payments, settlement, tokenization, and infrastructure.
Bitcoin’s network fundamentals remain intact. Hash rate, long-term holder supply, and institutional integration continue to trend upward despite short-term price pain.
10. Conclusion: Capitulation or Opportunity?
Bitcoin’s drop below $64,000 represents one of the most intense sell-offs of the current cycle—but intensity is often a feature of bottoms, not just tops.
The convergence of long-term technical levels, on-chain cost basis support, extreme sentiment readings, and rapid deleveraging suggests that the market is closer to exhaustion than to the beginning of a prolonged collapse.
This does not guarantee an immediate rebound. However, history shows that periods marked by fear, losses, and disbelief tend to offer the most attractive entry points for those with patience and conviction.
For readers seeking new crypto assets, sustainable revenue models, and practical blockchain applications, this phase may ultimately be remembered not as the start of a bear market—but as the reset that cleared the path for the next structural expansion.