Key Takeaways :
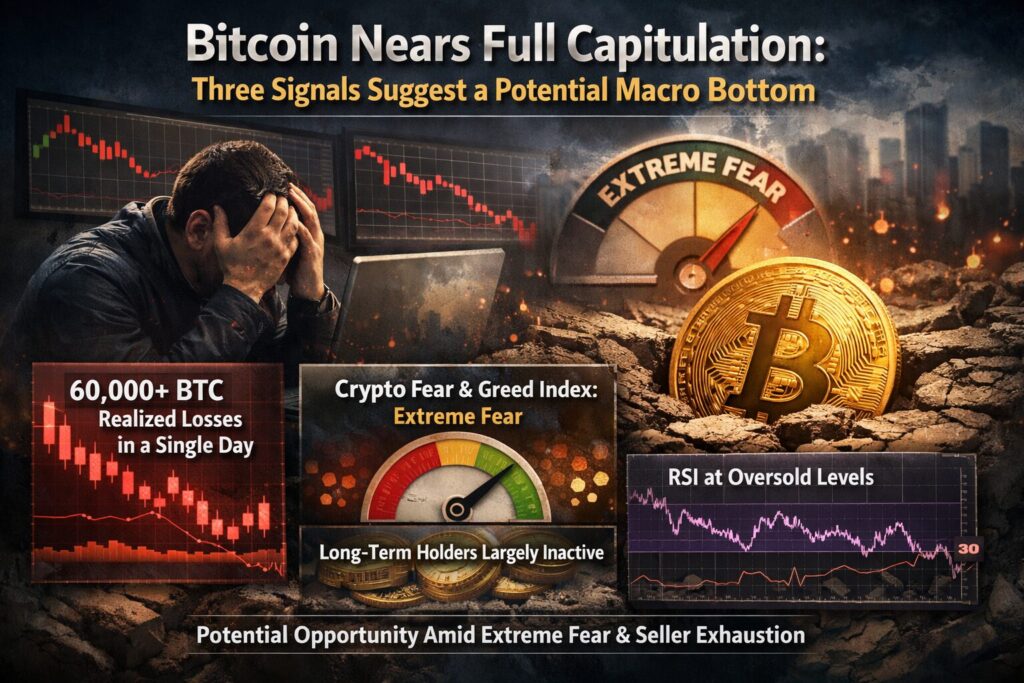
- Short-term Bitcoin holders have realized losses on nearly 60,000 BTC in a single day, signaling panic-driven capitulation.
- Market sentiment indicators, including the Crypto Fear & Greed Index, have plunged into “Extreme Fear,” historically associated with market bottoms.
- The Relative Strength Index (RSI) across multiple timeframes shows one of the most oversold conditions since the 2022 bear market, suggesting seller exhaustion.
- On-chain data implies that long-term holders remain largely inactive, reinforcing the narrative of a late-stage capitulation rather than a structural breakdown.
- For investors seeking asymmetric risk-reward opportunities, these conditions often precede periods of stabilization and eventual recovery, though volatility may persist.
Introduction: When Fear Peaks, Opportunity Often Emerges
Bitcoin has once again entered a period of intense stress. On Thursday, BTC fell below $69,000, marking its lowest level since November 6, 2024. Renewed selling pressure, driven primarily by short-term holders, has raised concerns that the market may not yet have found a definitive bottom.
However, beneath the surface of falling prices lies a more nuanced story. A convergence of on-chain metrics, sentiment indicators, and technical signals suggests that Bitcoin may be approaching what analysts describe as “full capitulation” — a phase historically associated with market bottoms rather than the beginning of prolonged declines.
This article examines three major signals pointing toward a possible capitulation event, contextualizes them within broader market trends, and explores what they may mean for investors and builders looking for the next cycle of opportunity in crypto and blockchain-based finance.
1. Deepening Capitulation Among Short-Term Holders
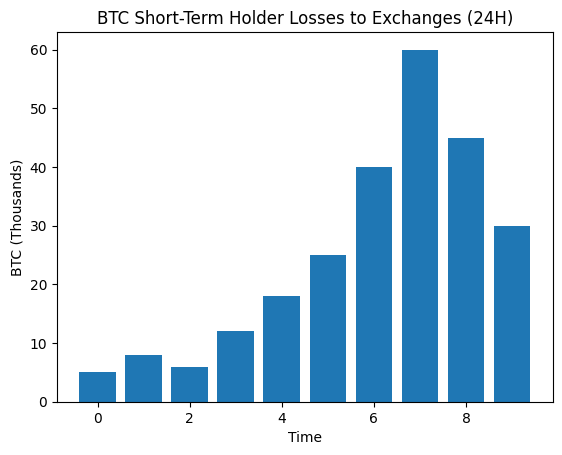
Short-term holders, defined as those who have held Bitcoin for less than 155 days, are often the most sensitive to price volatility. According to on-chain analytics, approximately 60,000 BTC — valued at roughly $4.2 billion at current prices — were transferred to exchanges in the past 24 hours at a realized loss.
This represents the largest single-day inflow of loss-making coins since the beginning of the year.
Crucially, data indicates that these flows are almost entirely driven by short-term holders. Long-term holders, historically considered the backbone of Bitcoin’s supply, are not engaging in meaningful profit-taking or panic selling.
An analyst from a leading on-chain data provider described the situation bluntly: the correction is severe, but it is concentrated among weaker hands. The absence of distribution from long-term holders suggests that this is not a confidence crisis in Bitcoin’s long-term value proposition, but rather a cleansing event within the speculative layer of the market.
From a historical perspective, such episodes often coincide with late-stage bear market dynamics or sharp corrective phases within broader uptrends.
[“BTC Short-Term Holder Losses to Exchanges (24H)” – line or bar chart showing spikes in realized losses]
Realized Losses and Seller Exhaustion
Further reinforcing this narrative, realized loss metrics have surged sharply. The seven-day moving average of realized losses has exceeded $1.26 billion per day, reflecting an environment dominated by fear-driven selling.
Historically, spikes in realized losses tend to align with moments when sellers become exhausted. Once market participants who are most prone to panic have exited their positions, marginal selling pressure often diminishes. This does not guarantee an immediate price reversal, but it frequently marks the transition from aggressive decline to consolidation.
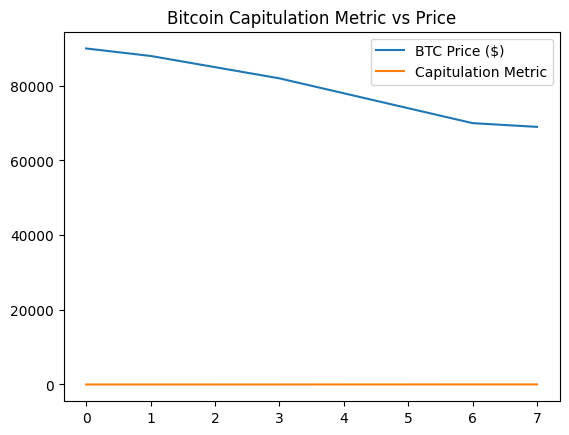
Another key metric, often referred to as a “capitulation indicator,” has recorded its second-largest spike in the past two years. Such spikes have previously coincided with periods of elevated volatility, forced deleveraging, and broad portfolio reallocation — conditions that often precede more stable market structures.
[“Bitcoin Capitulation Metric vs Price” – overlay chart with price and capitulation spikes]
2. Extreme Fear Dominates Market Sentiment
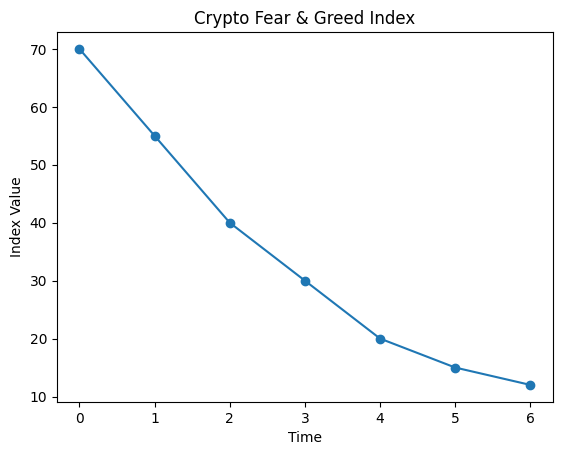
Sentiment indicators provide valuable context for understanding how market participants collectively perceive risk. The Crypto Fear & Greed Index recently dropped to a score of 12, firmly within the “Extreme Fear” category.
The last time sentiment reached comparable levels, Bitcoin was trading near $15,500 during the depths of the previous bear market. In the months that followed, prices stabilized and eventually transitioned into a sustained recovery phase.
While extreme fear can persist for extended periods, historical analysis shows that nearly every instance of such sentiment has been followed by at least a short- to medium-term rebound.
This does not imply that prices must immediately reverse upward. Instead, it suggests that downside risk may become increasingly asymmetric: further declines are possible, but the potential reward for long-term accumulation often improves significantly at these levels.
[“Crypto Fear & Greed Index Over Time” – time-series chart highlighting extreme fear zones]
Retail Capitulation and Contrarian Signals
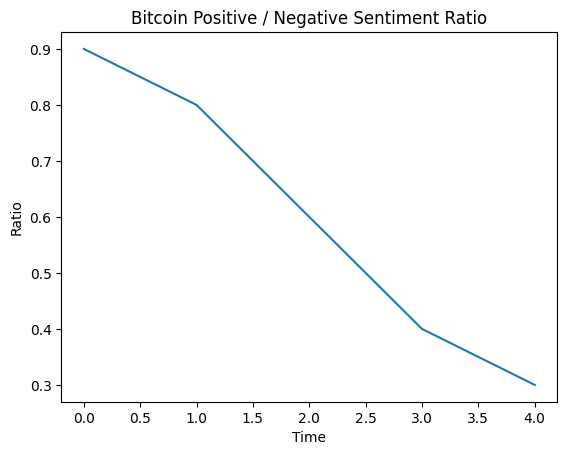
Additional sentiment analysis platforms indicate that retail investors have become overwhelmingly bearish toward Bitcoin and the broader crypto market. Social sentiment ratios show a pronounced imbalance, with negative commentary vastly outweighing positive outlooks.
From a contrarian perspective, such conditions often strengthen the case for a relief rally. When skepticism becomes near-universal, even modest positive catalysts can trigger sharp price reactions due to under-positioning and short covering.
For builders and long-term participants, this environment often coincides with reduced noise, lower speculative excess, and a renewed focus on fundamentals and real-world use cases — conditions that historically foster meaningful innovation.
[“Bitcoin Positive vs Negative Sentiment Ratio” – sentiment oscillator chart]
3. RSI Signals One of the Most Oversold Conditions in Years
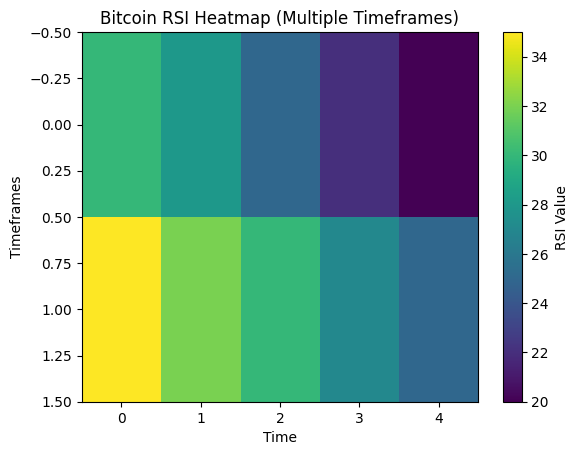
Technical indicators further reinforce the capitulation narrative. The Relative Strength Index (RSI), a widely used momentum indicator, has reached deeply oversold levels across multiple timeframes.
On the 12-hour chart, RSI has fallen to 18. On the daily chart, it stands near 20. Even on the weekly timeframe, RSI has dipped below 30 — a level rarely seen outside of major bear market bottoms.
Comparisons to historical data show that Bitcoin has not experienced such uniformly oversold conditions since the 2022 market collapse. At that time, prices ultimately formed a long-term bottom after a period of consolidation.
While RSI alone is not a precise timing tool, extreme readings often indicate that selling momentum is unsustainable. When combined with on-chain evidence of short-term holder capitulation, the risk-reward profile begins to tilt in favor of patient buyers rather than forced sellers.
[“Bitcoin RSI Heatmap Across Timeframes” – multi-timeframe heatmap visualization]
What This Means for Investors and Builders
For investors seeking new crypto assets or yield opportunities, periods of capitulation are rarely comfortable — but they are often formative. Historically, many of the most attractive long-term entry points have emerged not when optimism is high, but when conviction is scarce.
For builders and operators exploring practical blockchain applications, market downturns frequently provide a strategic advantage. Reduced speculative pressure allows teams to focus on infrastructure, compliance, scalability, and integration with real-world financial systems.
In recent months, institutional interest in tokenized assets, on-chain settlement, and regulated crypto financial products has continued to grow, even as spot prices decline. This divergence between price action and underlying development underscores the cyclical nature of crypto markets.
Conclusion: Capitulation as a Reset, Not an End
Bitcoin’s current price action reflects fear, stress, and forced selling — but not abandonment. The data suggests a market undergoing a painful reset rather than a structural collapse.
Short-term holders are capitulating, sentiment has reached extreme pessimism, and technical indicators point to seller exhaustion. While volatility may remain elevated in the near term, these conditions have historically marked the transition from decline to recovery.
For those searching for the next generation of crypto opportunities — whether through investment, yield strategies, or real-world blockchain deployment — moments like these often lay the groundwork for the next cycle of growth.
Capitulation is rarely the end of the story. More often, it is the chapter where the foundation for the future is quietly rebuilt.