Bitcoin has lost key long-term bull market support levels and failed to recover from a 10-month low.
Historical EMA crossover patterns suggest further downside risk rather than a short-term correction.
On-chain data indicates a potential transition from a cyclical pullback to a structural bear market.
CME futures gaps may trigger short-term rebounds, but broader market structure remains fragile.
For investors and builders, the current phase may represent both heightened risk and strategic opportunity.
1. Bitcoin’s Recent Decline: Losing Critical Psychological and Technical Levels
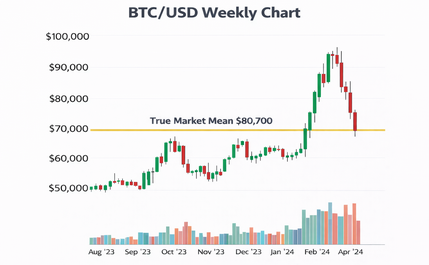
Bitcoin (BTC) entered the latest trading week under heavy pressure, slipping below the $50,000 mark ahead of the weekly close. This move followed a sharp decline of more than 6% in a single day, highlighting the fragility of bullish momentum after months of sideways consolidation.
Despite attempts by buyers to reclaim higher ground, Bitcoin failed to sustain a recovery from its lowest price levels in nearly ten months. Market participants widely interpreted this failure as confirmation that bullish control has weakened significantly.
From a technical perspective, Bitcoin has now decisively lost several historically important support levels, including what many analysts describe as the “true market mean” near $80,700. This level has previously acted as a pivot during bull market continuations, and its loss has shifted sentiment decisively toward caution.
2. Historical Price Patterns: When EMA Crossovers Turn Bearish
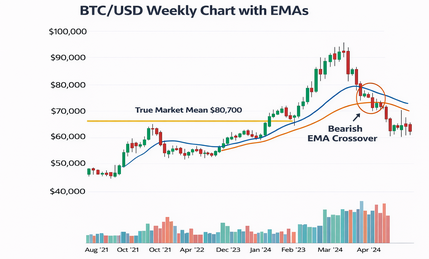
One of the most widely discussed technical signals in recent days has been Bitcoin’s interaction with its long-term exponential moving averages (EMAs). In particular, the relationship between the 21-week EMA and the 50-week EMA has drawn close scrutiny.
Several analysts, including trader and market commentator Rekt Capital, have pointed out that Bitcoin recently experienced a bullish EMA crossover — a signal that, paradoxically, has historically preceded further downside during late-cycle or early-bear phases.
Following this crossover, Bitcoin fell approximately 17%, dropping from around $90,000 to near $78,000 before continuing lower. A similar pattern occurred in April 2022, shortly before Bitcoin entered a prolonged bear market.
According to Rekt Capital:
“So far, history is repeating itself. After the bull market EMA crossover, Bitcoin is once again seeing downside continuation rather than immediate upside expansion.”
This pattern challenges the assumption that all bullish technical signals guarantee higher prices. In mature market cycles, such signals may instead mark distribution phases where long-term holders reduce exposure.
BTC/USD weekly chart with 21-week and 50-week EMAs highlighting historical crossover points
3. Downside Liquidity Targets: Where Bears Are Watching
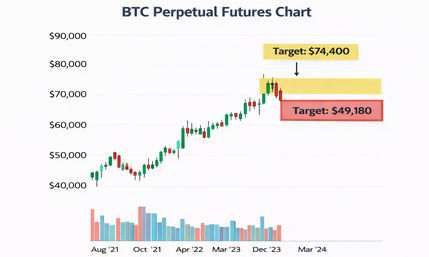
With bullish support eroding, traders have begun to identify downside liquidity zones that could act as potential price magnets. Analyst Cmt_trader has highlighted two primary levels of interest:
$74,400 – a near-term liquidity pool tied to prior consolidation zones
$49,180 – a deeper target aligned with historical bear market retracements
These levels are not predictions in the traditional sense but rather areas where large clusters of stop-loss orders and unfilled bids are likely to exist. In declining markets, price often gravitates toward such zones before establishing a durable bottom.
From a risk-management perspective, these targets underscore why many traders are reducing leverage and increasing stablecoin exposure until clearer confirmation emerges.
BTC perpetual futures chart with highlighted downside liquidity targets
4. CME Futures Gap: Short-Term Relief or False Hope?
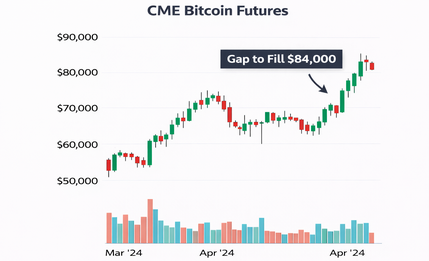
Despite the broader bearish structure, some analysts remain cautiously optimistic about short-term price action. This optimism centers on a newly formed gap in the Chicago Mercantile Exchange (CME) Bitcoin futures market near $84,000.
CME gaps often act as temporary “price magnets,” with Bitcoin historically revisiting these levels before resuming its dominant trend. Trader Killa has suggested that this gap could be filled within the coming weeks, offering a relief rally for oversold conditions.
However, it is crucial to distinguish between tactical rebounds and structural reversals. Even if Bitcoin rallies toward $84,000, such a move would not automatically invalidate the broader bearish thesis unless accompanied by strong volume and reclaiming of long-term support.
For experienced market participants, CME gaps are tools for timing entries and exits — not signals of long-term trend changes.
CME Bitcoin futures chart showing the unfilled gap near $84,000
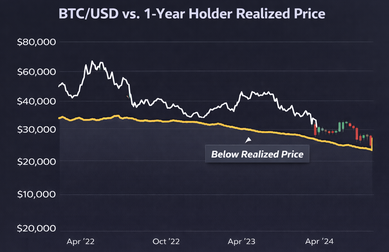
Beyond technical charts, on-chain data paints a more sobering picture. According to CryptoQuant, Bitcoin’s spot price has now fallen below the realized price of holders who have held their coins for 12 to 18 months.
The realized price represents the average cost basis at which coins last moved on-chain. When market price drops below this level, it implies that a large cohort of long-term holders is now underwater.
CryptoQuant contributor Crazyblock warns that sustained trading below realized price historically marks a shift from normal corrections to structural bear markets:
“When price breaks below realized cost and remains there, market behavior changes fundamentally. This is not a dip-buying environment — it is a regime shift.”
Further analysis shows that realized price itself has flattened, reinforcing its role as overhead resistance rather than support. In such environments, any upward price movement tends to face selling pressure from participants seeking to exit at breakeven.
BTC/USD chart with 1-year holder realized price overlay
6. Structural Bear Markets vs. Cyclical Corrections
Historically, the combination of the following factors has aligned with extended bear markets:
Spot price below realized price
Negative unrealized profit and loss (UPnL) across large holder cohorts
Slowing growth in on-chain balances
Weak spot demand relative to derivatives volume
At present, Bitcoin exhibits many of these characteristics. While this does not guarantee an immediate collapse, it suggests that recovery may be slower and more volatile than typical mid-cycle pullbacks.
For investors focused on long-term capital allocation, this distinction matters. Structural bear phases tend to reward patience, liquidity preservation, and selective accumulation rather than aggressive speculation.
7. Implications for Investors, Builders, and New Crypto Opportunities
For readers seeking new crypto assets, revenue streams, or practical blockchain use cases, bear markets are not merely periods of decline — they are environments of re-pricing and experimentation.
Historically, some of the most influential crypto projects have gained traction during bearish conditions, when speculation fades and fundamentals regain importance. Infrastructure, payments, compliance-focused blockchain services, and real-world asset tokenization often attract more serious capital during such phases.
From a strategic standpoint, the current Bitcoin environment encourages:
Greater emphasis on risk-adjusted returns rather than raw upside
Exploration of yield-neutral strategies, such as infrastructure fees or enterprise blockchain services
Evaluation of non-correlated crypto sectors, including data availability, identity, and settlement layers
Rather than asking how fast Bitcoin can recover, sophisticated participants may ask which systems will still matter if volatility persists for another 12–24 months.
8. Conclusion: A Market at a Crossroads
Bitcoin’s recent price action reflects more than short-term fear. The loss of critical support levels, alignment with historical EMA-driven downturns, and deterioration in on-chain cost structures collectively suggest that the market may be entering a prolonged period of adjustment.
While short-term rebounds driven by technical factors such as CME gaps are possible, they should not be mistaken for confirmation of a renewed bull market. Instead, the current phase demands discipline, data-driven analysis, and a willingness to adapt strategies.
For those willing to look beyond price charts, this environment may ultimately prove fertile — not for speculation, but for building the next generation of blockchain-based financial infrastructure.
About Us and Media
Blockchain and cryptocurrency media covering and exposing the practical application development on the blockchain industry and undiscovered coins.
Click edit button to change this text. Lorem ipsum dolor sit amet, consectetur adipiscing elit
Manage Consent
To provide the best experiences, we use technologies like cookies to store and/or access device information. Consenting to these technologies will allow us to process data such as browsing behavior or unique IDs on this site. Not consenting or withdrawing consent, may adversely affect certain features and functions.
Functional
Always active
The technical storage or access is strictly necessary for the legitimate purpose of enabling the use of a specific service explicitly requested by the subscriber or user, or for the sole purpose of carrying out the transmission of a communication over an electronic communications network.
Preferences
The technical storage or access is necessary for the legitimate purpose of storing preferences that are not requested by the subscriber or user.
Statistics
The technical storage or access that is used exclusively for statistical purposes.The technical storage or access that is used exclusively for anonymous statistical purposes. Without a subpoena, voluntary compliance on the part of your Internet Service Provider, or additional records from a third party, information stored or retrieved for this purpose alone cannot usually be used to identify you.
Marketing
The technical storage or access is required to create user profiles to send advertising, or to track the user on a website or across several websites for similar marketing purposes.