Main Points :
- Bitcoin sharply declined alongside equities after renewed U.S. tariff concerns related to Greenland triggered global risk-off sentiment.
- Gold surged to an all-time high, reinforcing its role as the primary short-term safe haven during geopolitical shocks.
- Bitcoin’s correlation with equities and commodities has risen in the short term, while its inverse correlation with gold has strengthened.
- Derivatives and options data suggest that market participants remain structurally bullish despite the sudden sell-off.
- Thin liquidity conditions, due to U.S. market holidays, amplified volatility and exaggerated price moves.
- Historically, similar tariff-driven shocks have caused temporary drawdowns in Bitcoin, followed by recovery phases.
- For investors and operators, the episode highlights Bitcoin’s dual identity: a speculative risk asset in the short run and a strategic alternative asset over longer horizons.
1. Market Shock Triggered by Geopolitical Tariff News
In mid-January 2026, Bitcoin (BTC) experienced a sharp and sudden decline, breaking its early-year upward trend. The immediate catalyst was not a crypto-specific issue, but rather a geopolitical shock: U.S. President Donald Trump announced additional tariffs targeting eight European countries in connection with Greenland-related trade concerns.
This announcement reverberated across global markets. Equity indices fell in tandem, risk-sensitive assets were sold aggressively, and volatility spiked. Bitcoin, increasingly intertwined with broader financial markets, did not escape this wave of selling pressure.
What made the move particularly abrupt was the market structure on that day. U.S. equity markets were closed for a public holiday, reducing overall liquidity. However, institutional participants could still trade Bitcoin derivatives via the CME, and price declines accelerated around the CME session open. In thin markets, even modest sell orders can cause outsized price movements, and this dynamic was clearly visible.
2. Bitcoin and Risk Assets: A Growing Short-Term Correlation
“Bitcoin vs Nasdaq 100 Correlation (2-Month Window)”
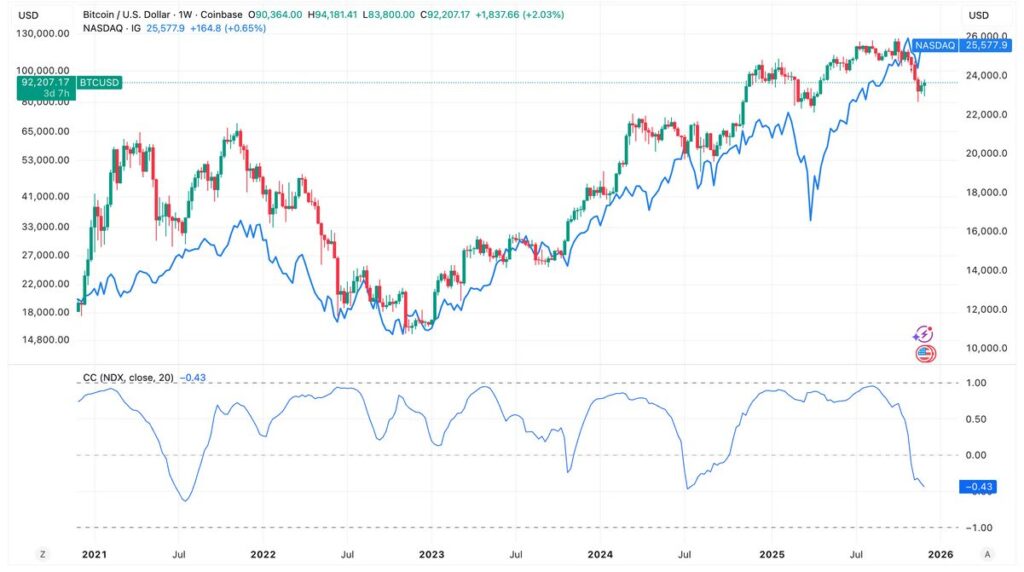
Over the two months leading up to January 19, Bitcoin’s correlation with the Nasdaq 100 rose to approximately +0.33. While not a perfect lockstep, this level indicates a meaningful degree of co-movement with U.S. technology equities.
This correlation reflects the evolving composition of Bitcoin market participants. Institutional investors, hedge funds, and proprietary trading firms increasingly manage Bitcoin exposure alongside equity and macro portfolios. When risk appetite deteriorates due to geopolitical shocks, portfolio-level de-risking can result in simultaneous selling across asset classes.
Bitcoin’s correlation with crude oil was even higher, around +0.55, underscoring its sensitivity to global growth expectations and macroeconomic sentiment in the short term.
3. Gold’s All-Time High: The Risk-Off Counterpart
“Bitcoin vs Gold Inverse Correlation”
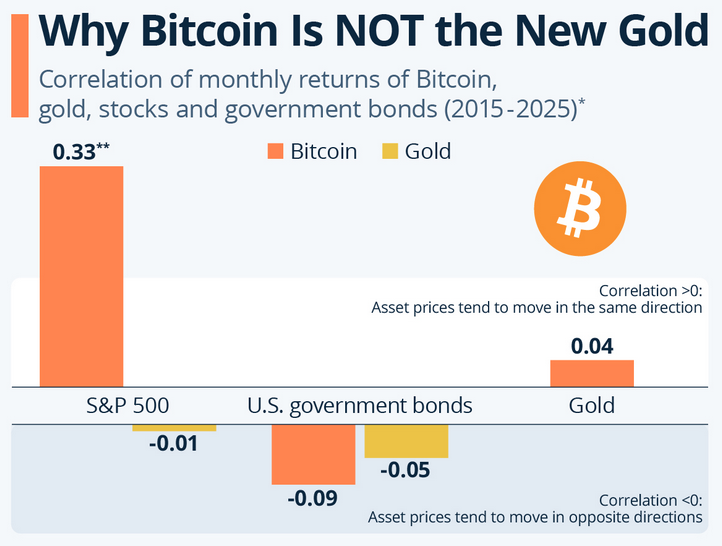
While Bitcoin and equities sold off, gold surged to a new all-time high. The inverse correlation between Bitcoin and gold during this period reached approximately −0.56, a strong signal that capital rotated decisively into traditional safe havens.
This divergence reinforces an important distinction. Despite long-term narratives positioning Bitcoin as “digital gold,” market behavior during acute geopolitical stress still favors physical gold as the first-line refuge. Bitcoin, at least for now, remains partially categorized as a risk asset when fear spikes suddenly.
However, this does not invalidate Bitcoin’s store-of-value thesis; rather, it highlights the difference between short-term market mechanics and long-term structural adoption.
4. Options Market Signals: Fear Without Capitulation
“Put-Call Ratio and Open Interest Distribution”
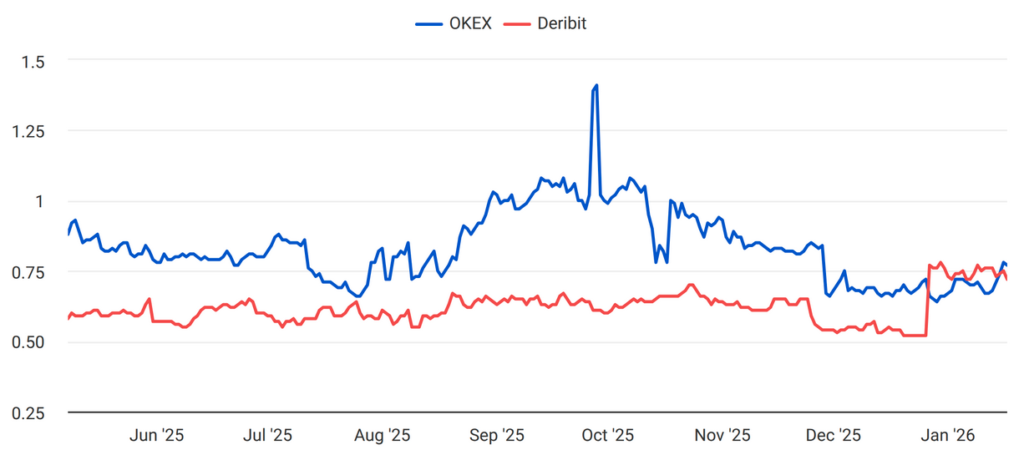
One of the most revealing aspects of this market episode lies in the derivatives data. Despite the sharp spot price decline, the put-call ratio (PCR) in the options market remained relatively low. This suggests that traders did not aggressively rush to buy downside protection.
Furthermore, open interest data shows that call options around the $100,000 strike remained the largest concentration. This positioning implies that many participants continue to expect higher prices over a medium-term horizon, viewing the recent sell-off as a temporary dislocation rather than a trend reversal.
In other words, while prices fell quickly, sentiment did not collapse.
5. Spot and Derivatives Flow: Buying the Dip
“Market Orders After the Sell-Off”
Trade flow analysis indicates that both spot and derivatives markets saw an increase in buy-side market orders following the initial drop. This pattern is consistent with dip-buying behavior by traders and longer-term holders.
In some derivatives venues, brief instances of backwardation were observed, where futures prices dipped below spot prices. Such conditions often precede short-covering rallies, as bearish positions become less attractive when near-term supply tightens.
6. Thin Liquidity and Holiday Effects
Another critical factor amplifying the move was liquidity—or the lack thereof. With U.S. ETF markets closed, a significant source of institutional flow was absent. Reduced depth makes markets more fragile, allowing sudden news events to have disproportionate impact.
This environment demands caution. In thin markets, volatility is not always a reliable signal of genuine shifts in fundamentals. For traders and risk managers, understanding the liquidity context is just as important as interpreting the headline news.
7. Historical Context: Tariffs and Bitcoin’s Resilience
This is not the first time tariff-related tensions have rattled Bitcoin. In April of the previous year, escalations in trade disputes under the Trump administration also caused Bitcoin to decline alongside equities.
Yet in that episode, Bitcoin eventually stabilized and resumed an upward trajectory. The pattern suggests that while Bitcoin may react negatively to macro shocks in the short run, its recovery dynamics often diverge once panic subsides.
The key question now is whether this episode will follow a similar path: a sharp shock, followed by consolidation and gradual recovery.
8. Strategic Implications for Investors and Builders
For investors, this event reinforces the importance of time horizon. Short-term traders must account for Bitcoin’s sensitivity to macro headlines and liquidity conditions. Long-term holders, however, may interpret such drawdowns as opportunities to accumulate exposure during periods of forced selling.
For builders and operators in the blockchain space, the message is equally important. Bitcoin’s integration into global financial markets is deepening. This increases volatility in the face of macro shocks, but also strengthens Bitcoin’s relevance as a globally traded financial asset.
9. Conclusion: Bitcoin at the Crossroads of Risk and Refuge
Bitcoin’s sudden drop in January 2026 was not driven by internal crypto weaknesses, but by a broader geopolitical shock that rippled through global markets. The simultaneous surge in gold highlights the market’s instinctive flight to safety, while derivatives data reveals that confidence in Bitcoin’s long-term trajectory remains largely intact.
This episode underscores Bitcoin’s current dual nature. In moments of acute stress, it behaves like a risk asset. Over longer horizons, it continues to attract strategic capital as an alternative monetary asset.
For those seeking new crypto assets, new revenue opportunities, or practical blockchain applications, the lesson is clear: understanding Bitcoin today requires not only on-chain analysis, but also a firm grasp of global macroeconomics.
Bitcoin is no longer isolated. It is embedded in the financial system—and that reality cuts both ways.