Main Points :
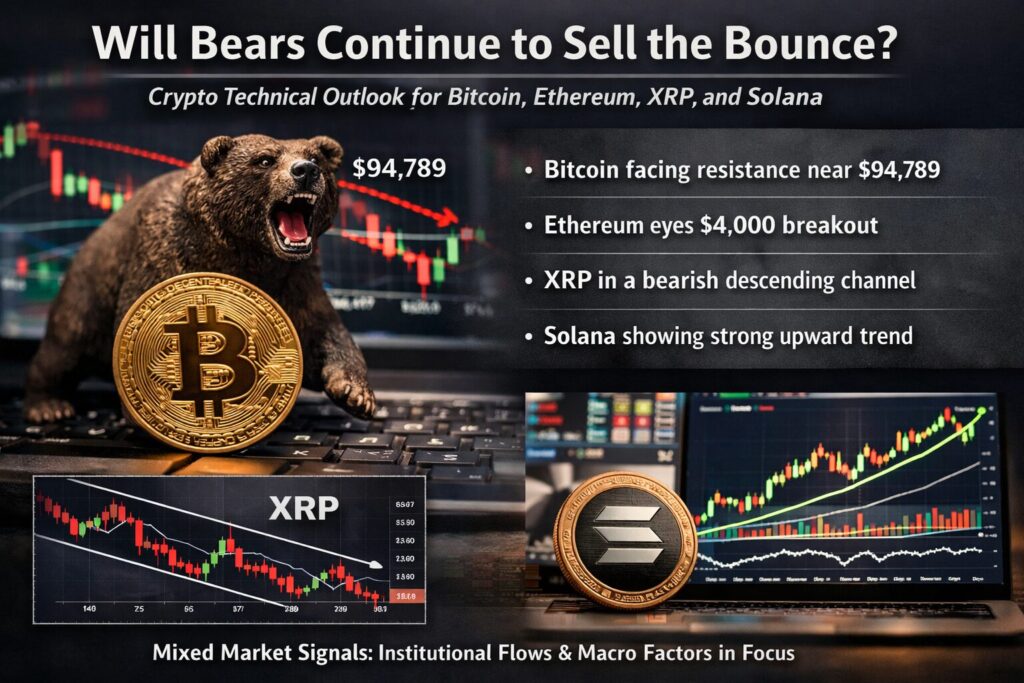
- Bitcoin is holding above its moving averages after a pullback, but strong resistance near $94,789 continues to cap upside momentum.
- Ethereum shows constructive strength near its 20-day EMA, with a decisive breakout potentially signaling a move toward $4,000.
- XRP remains under sustained bearish pressure, trading within a descending channel where downside risks still dominate.
- Solana displays one of the strongest technical structures among major altcoins, supported by rising EMAs and a healthy RSI.
- Broader crypto markets reflect a transitional phase where selective strength exists, but bearish participants continue to sell into rallies.
- Institutional positioning, ETF flows, and macro liquidity conditions remain critical secondary drivers beyond chart patterns.
1. Market Context: A Fragile Recovery in a Bear-Dominated Environment
The cryptocurrency market has entered a delicate phase where price rebounds are emerging, yet conviction remains uneven. While major digital assets such as Bitcoin, Ethereum, XRP, and Solana have shown signs of stabilization, bearish participants continue to actively sell into rallies. This behavior reflects lingering uncertainty over whether the recent pullbacks represent healthy consolidations within an ongoing bull cycle or early warnings of a broader corrective phase.
From a macro perspective, crypto markets are navigating mixed signals. On one hand, institutional adoption continues through spot Bitcoin ETFs, growing derivatives volumes, and expanding on-chain infrastructure. On the other hand, tightening financial conditions, regulatory scrutiny, and profit-taking at elevated price levels have tempered aggressive risk-taking.
Technical analysis provides a structured way to evaluate this tension. By analyzing support and resistance levels, moving averages, trendlines, and momentum indicators, traders and long-term investors can better assess whether the market is preparing for continuation or rejection.
2. Bitcoin (BTC): Consolidation at a Critical Inflection Point
[Bitcoin (BTC/USDT) Daily Chart]
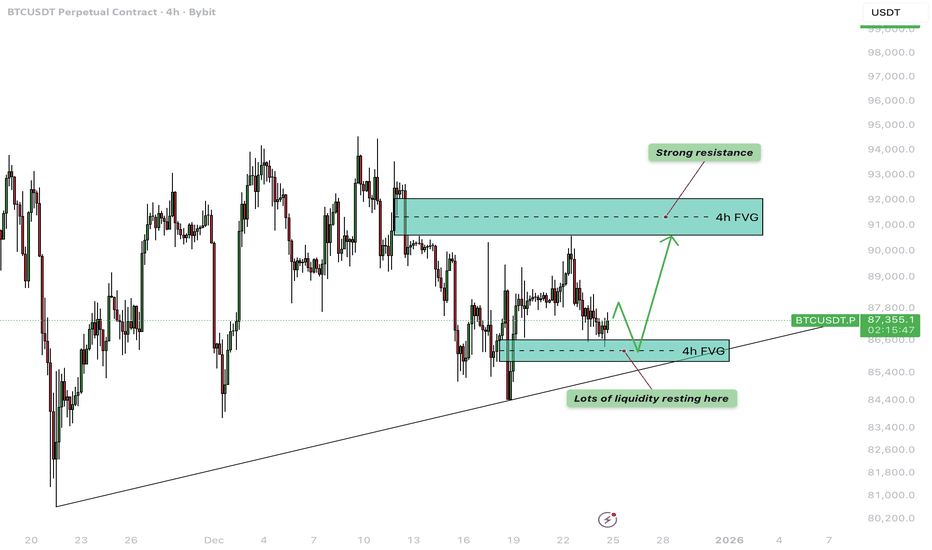
Bitcoin recently corrected from the $94,789 resistance level before finding support near its moving averages. This price behavior suggests that buyers are still willing to accumulate on dips, indicating underlying demand rather than panic-driven selling.
Bullish Scenario
If bulls succeed in pushing BTC decisively above $94,789 on a daily closing basis, the technical landscape would shift meaningfully. Such a breakout would likely trigger momentum-driven buying, opening a path toward the psychologically significant $100,000 level. Beyond that, an extension toward $107,500 becomes technically plausible, marking a continuation of the broader uptrend.
This scenario would strongly suggest that the recent consolidation phase is nearing completion rather than signaling distribution.
Bearish Scenario
Conversely, failure to reclaim $94,789 followed by a breakdown below key moving averages would reinforce the view that bears remain active at higher price levels. Under this outcome, Bitcoin could remain range-bound between approximately $84,000 and $94,789 for an extended period.
Such sideways movement would reflect indecision rather than outright weakness, but it would delay any meaningful upside expansion.
3. Ethereum (ETH): Buyers Defend the 20-Day EMA
[Ethereum (ETH/USDT) Daily Chart]
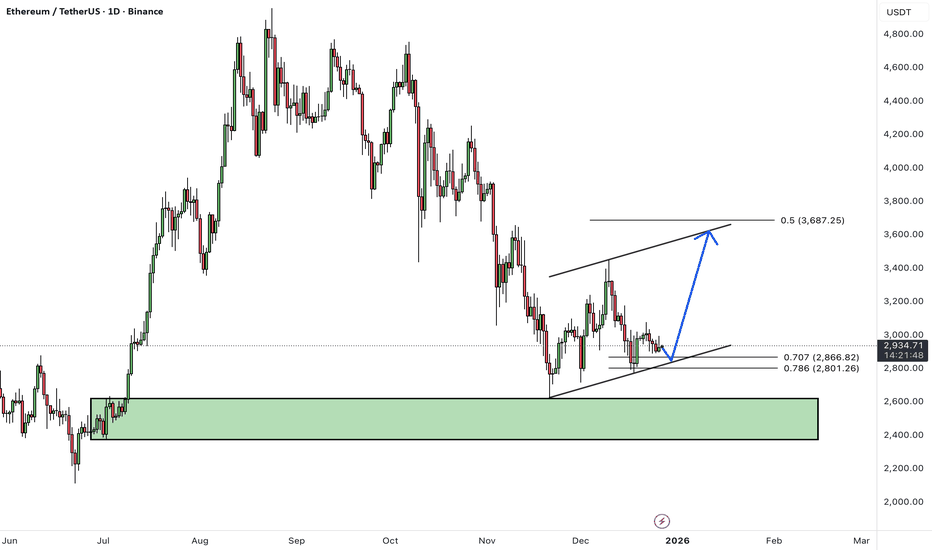
Ethereum has shown relative strength by rebounding from its 20-day exponential moving average (EMA) near $3,088. This technical response suggests that buyers are actively defending short-term trend support.
Bullish Scenario
A daily close above the prevailing resistance zone would tilt the advantage toward buyers. Under this condition, ETH could rally toward $3,569 and potentially extend to the psychologically important $4,000 level. Such a move would signal renewed confidence in Ethereum’s medium-term outlook, especially given its role as the backbone of decentralized finance (DeFi), NFTs, and Layer 2 scaling solutions.
Bearish Scenario
If Ethereum fails at resistance and falls below its moving averages, price action could remain confined within a symmetrical triangle pattern for several days. A decisive breakdown below the triangle’s support line would significantly favor bears, potentially accelerating losses toward $2,623.
This risk highlights the importance of the current technical zone as a battleground between accumulation and distribution.
4. XRP: Persistent Downtrend Keeps Bears in Control
[XRP (XRP/USDT) Daily Chart]
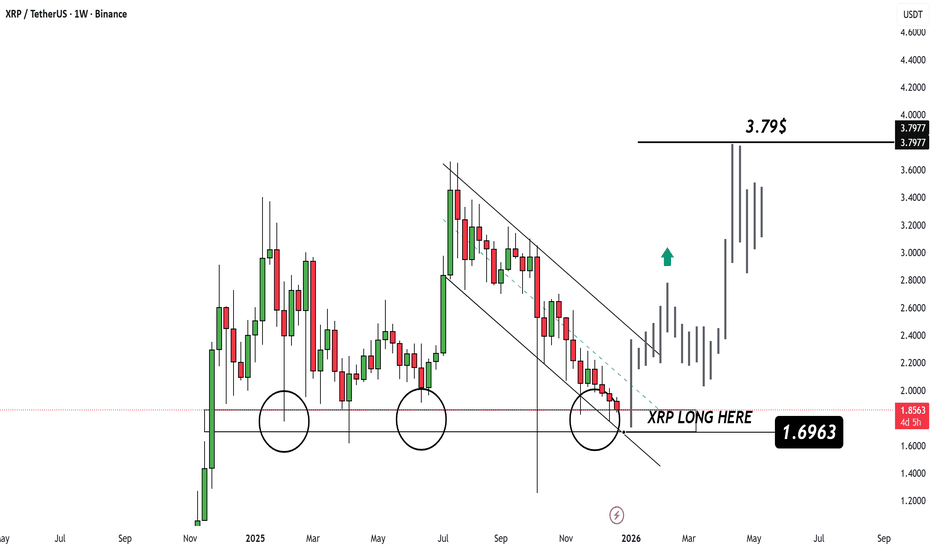
XRP continues to struggle relative to other major cryptocurrencies. Despite buyers attempting to defend the moving averages, sustained selling pressure has kept the asset locked within a descending channel.
Bearish Continuation Risk
A breakdown below the moving averages would likely prolong XRP’s stay within the descending channel. The $1.61 level represents a critical support zone; a daily close below it would substantially increase the probability of a decline toward $1.25, the October 10 low.
This scenario reflects not only technical weakness but also ongoing uncertainty surrounding XRP’s broader adoption narrative.
Bullish Reversal Scenario
For a meaningful trend reversal to occur, XRP must break above its descending trendline. Achieving this would indicate that selling pressure has been absorbed. If successful, upside targets emerge at $2.70 and subsequently $3.10.
Until such a breakout occurs, rallies are likely to be met with selling rather than sustained follow-through.
5. Solana (SOL): Relative Strength Among Major Altcoins
[Solana (SOL/USDT) Daily Chart]
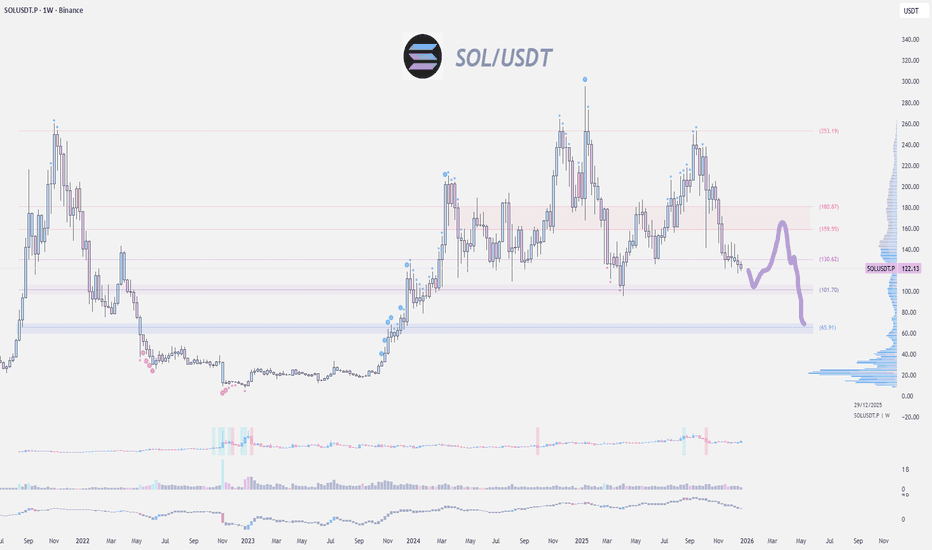
Solana stands out as one of the technically strongest large-cap cryptocurrencies. Price rebounded from its moving averages and advanced toward the $147 level, where bears are expected to defend aggressively.
The upward-sloping 20-day EMA near $134 and an RSI above 64 suggest that bullish momentum remains intact.
Bullish Scenario
A daily close above $147 would likely confirm the start of a new upward leg, with $172 emerging as the next major target. This structure indicates that buyers are in control, supported by Solana’s growing ecosystem and high-throughput blockchain design.
Range-Bound Risk
If SOL fails to hold above its moving averages, price may oscillate between $117 and $147. While such consolidation would not immediately invalidate the bullish trend, it would suggest a temporary pause rather than an immediate continuation.
6. Broader Implications for Investors and Builders
For investors seeking new digital assets and income opportunities, the current environment favors selectivity over broad exposure. Bitcoin and Ethereum remain structural anchors, while Solana offers relative momentum among altcoins. XRP, by contrast, remains a higher-risk proposition until technical and narrative clarity improves.
From a practical blockchain usage perspective, these market dynamics influence treasury management, liquidity provisioning, and risk controls for exchanges, VASPs, and DeFi protocols. Understanding technical ranges helps institutions calibrate collateral requirements, hedge exposure, and time liquidity deployment more effectively.
7. Conclusion: A Market at a Crossroads
The cryptocurrency market is currently balancing between resilience and hesitation. While buyers continue to defend key technical levels, bearish participants remain willing to sell into strength. This tug-of-war suggests that the coming weeks will be decisive in determining whether recent pullbacks evolve into renewed uptrends or prolonged consolidation phases.
For market participants, disciplined risk management and clear technical frameworks remain essential. Breakouts above resistance levels could reignite momentum, while failures may reinforce range-bound or corrective behavior. In this environment, patience and precision matter more than ever.