
Main Points :
- Bitcoin is facing sustained selling pressure near its 50-day moving average, with bears targeting the $84,000 support zone.
- Ethereum is at a technical crossroads, as sellers attempt to break a symmetrical triangle pattern.
- XRP remains trapped in a descending channel, with momentum hinging on whether it can reclaim key moving averages.
- Solana shows early signs of bullish divergence, but sellers still dominate unless critical resistance is cleared.
- Across major assets, short-term sentiment favors caution, but structurally important accumulation zones are forming for medium- to long-term participants.
Introduction: A Market at an Inflection Point
The cryptocurrency market is once again approaching a decisive moment. After a strong rally earlier in the year, major digital assets such as Bitcoin (BTC), Ethereum (ETH), XRP, and Solana (SOL) are now exhibiting signs of fatigue. Technical indicators suggest that bearish participants are attempting to regain control, particularly near key moving averages and structural support levels.
This article expands on recent chart-based analysis by integrating broader market context, historical behavior, and practical implications for investors and builders seeking new crypto assets, alternative revenue streams, and real-world blockchain use cases. Rather than offering short-term trading advice, the goal is to help readers understand where the market stands, why these levels matter, and how capital typically behaves during similar phases.
Bitcoin Price Outlook: Defending the Psychological Core
Bitcoin has recently pulled back after failing to hold above its 50-day simple moving average, currently around $90,525. This rejection indicates that sellers remain active at higher price levels, using rallies as opportunities to reduce exposure.
Technical Structure and Key Levels
Bears are now attempting to push Bitcoin toward the $84,000 support zone. This level has repeatedly acted as a demand area where long-term holders and institutional participants tend to accumulate. If Bitcoin closes decisively below $84,000, downside momentum could accelerate toward $80,600, with a deeper correction potentially reaching $74,508.
Conversely, a strong rebound from current levels or from the $84,000 region would suggest that buyers are still confident in Bitcoin’s long-term thesis. A daily close above $90,600 would be the first sign that bullish momentum is returning, opening the path toward the major resistance near $94,589.
Broader Context
From a macro perspective, Bitcoin continues to function as the liquidity anchor of the crypto ecosystem. Even during corrective phases, on-chain data historically shows accumulation by large wallets during pullbacks of this nature. For participants exploring Bitcoin not merely as a speculative asset but as a treasury or settlement layer, such retracements often represent strategic positioning zones rather than exit signals.
Bitcoin Daily Chart (BTC/USD): Support and Resistance Zones
Daily candlestick chart with 50-day SMA, highlighting $84,000, $80,600, and $94,589 levels

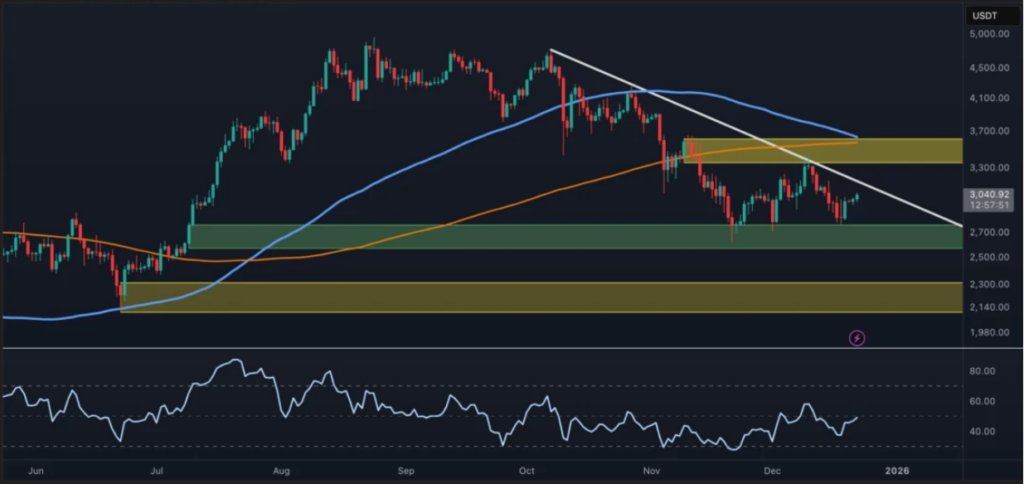
Ethereum Price Outlook: The Battle Within the Triangle
Ethereum attempted to break above its moving averages earlier this week but failed to sustain the move, signaling that sellers are still defending higher levels aggressively.
Symmetrical Triangle Breakdown Risk
ETH is currently trading within a symmetrical triangle, a pattern that typically precedes a strong directional move. Sellers are attempting to force a breakdown below the triangle’s support line. If successful, Ethereum could quickly fall toward $2,623, with a deeper decline extending to $2,373.
On the other hand, if ETH rebounds from support and closes above its moving averages, it would suggest renewed accumulation at lower levels. In such a scenario, price could advance toward the triangle’s resistance line, where bears are expected to mount a strong defense.
Strategic Interpretation
Ethereum’s importance extends far beyond price action. As the backbone of DeFi, NFTs, restaking, and tokenized real-world assets, ETH corrections often reflect leverage unwinding rather than structural weakness. For builders and long-term participants, periods of compressed volatility like this historically precede major ecosystem expansions.
Ethereum Daily Chart (ETH/USD): Symmetrical Triangle Formation
Triangle pattern with breakdown and breakout scenarios illustrated
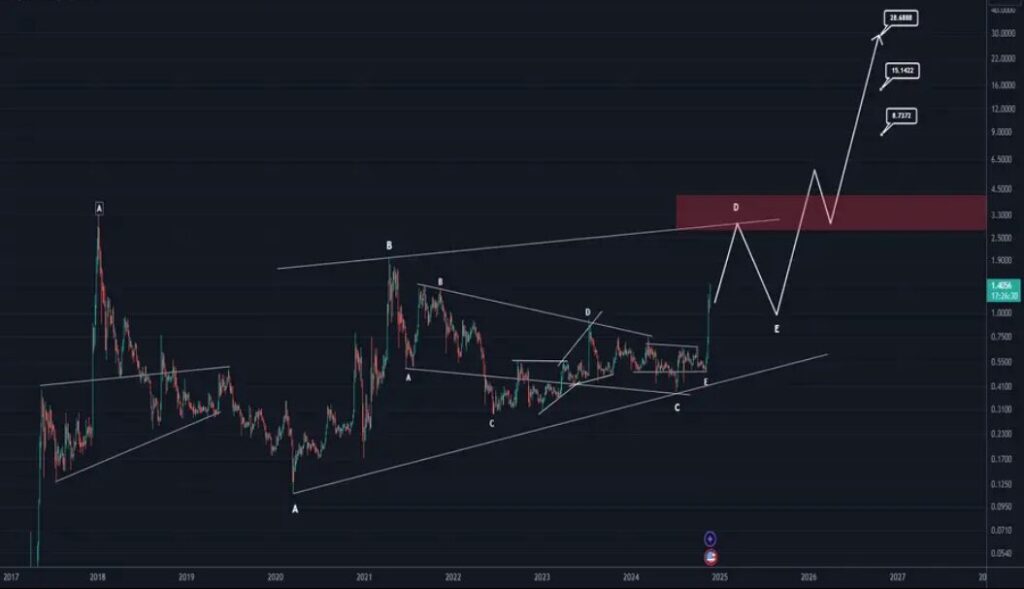
XRP Price Outlook: Trapped in a Descending Channel
XRP buyers are attempting a recovery, but the asset continues to face selling pressure near its 20-day exponential moving average around $1.92.
Downside and Upside Scenarios
If price reverses sharply from the moving average zone, it would confirm that bears are selling into relief rallies. In that case, XRP could slide toward the lower boundary of its descending channel. A daily close below $1.61 would significantly weaken the structure, potentially opening the path to a retest of the $1.25 low seen earlier in the cycle.
Alternatively, a decisive close above the 50-day SMA near $2.06 could trigger a rapid move toward the descending trendline. A breakout above that trendline would be a strong signal of trend reversal, suggesting that the prolonged corrective phase may be ending.
Market Psychology
XRP’s price behavior often reflects regulatory and narrative-driven sentiment more than pure technicals. However, historically, prolonged compression within descending channels has preceded explosive moves once uncertainty clears. For investors focused on asymmetric opportunities, XRP remains a classic “high-volatility resolution” candidate.
XRP Daily Chart (XRP/USD): Descending Channel Analysis
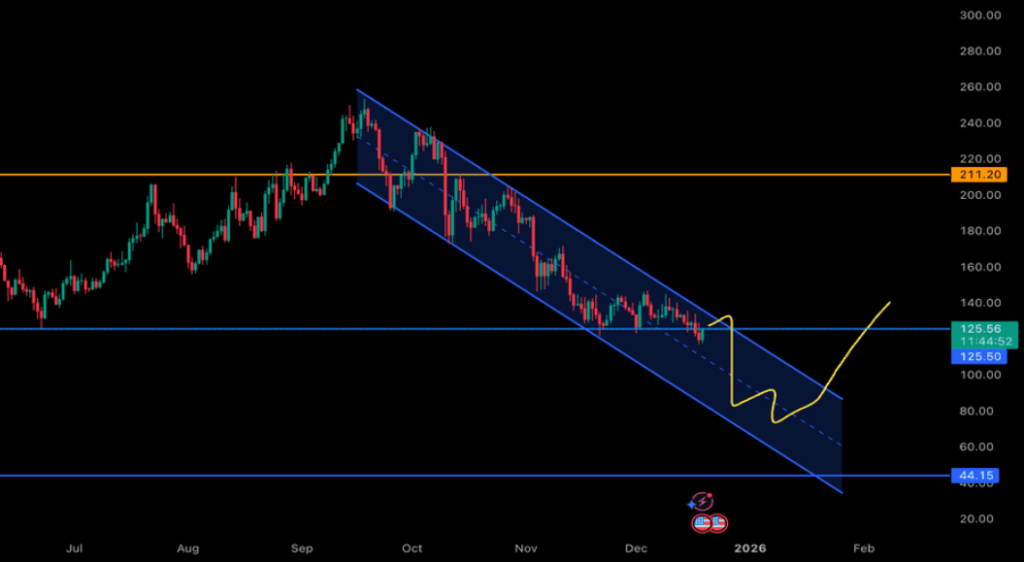
Solana Price Outlook: Early Signals Beneath the Surface
Solana briefly moved above its 20-day EMA around $126 but failed to hold higher ground, indicating that sellers remain in control in the short term.
Support, Resistance, and RSI Divergence
Bears are attempting to push SOL toward $116. If that level breaks, the next downside targets lie at $110, followed by a strong structural support near $95.
However, a notable technical development is the positive divergence on the Relative Strength Index (RSI). This suggests that downside momentum is weakening, even as price continues to consolidate. To confirm a bullish shift, Solana must reclaim its 50-day SMA near $133. A successful breakout could propel price toward $147, a major resistance zone.
Ecosystem Implications
Solana’s ecosystem remains one of the most active in terms of consumer-facing applications, DePIN, and high-throughput use cases. As with Ethereum, technical pullbacks often coincide with intense development activity rather than ecosystem stagnation.
Solana Daily Chart (SOL/USD): RSI Divergence and Key Levels
Conclusion: Caution in the Short Term, Opportunity in Structure
Across Bitcoin, Ethereum, XRP, and Solana, bearish pressure is clearly present in the short term. Sellers are defending key moving averages, and several assets are at risk of further downside if critical support levels fail.
However, history shows that such phases often represent redistribution rather than collapse. Long-term capital tends to accumulate during periods of uncertainty, particularly near structurally important levels. For readers seeking new crypto assets, sustainable revenue models, or practical blockchain applications, understanding these phases is essential.
Rather than asking “Is the market bullish or bearish?”, a more productive question may be:
“Who is accumulating, at what levels, and for what horizon?”


