Main Points :
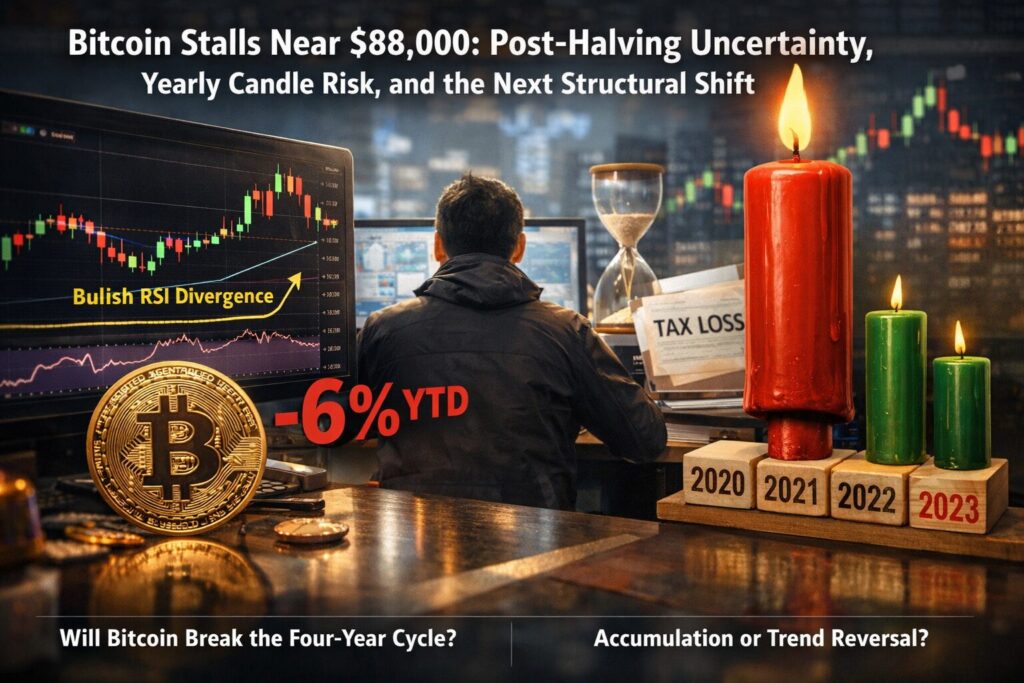
- Bitcoin has entered an unusually calm consolidation phase around $88,000, even as year-end approaches.
- A three-day bullish RSI divergence is forming, historically associated with major price bottoms.
- Despite bullish technical signals, Bitcoin is down roughly 6% year-to-date, raising the risk of the first post-halving red yearly candle.
- Large derivatives expiries, tax-loss harvesting, and institutional rebalancing are distorting short-term price action.
- The outcome of the yearly close may challenge the long-standing four-year Bitcoin cycle thesis.
- For long-term investors and builders, this phase may represent structural accumulation rather than trend failure.
1. A Quiet Market at a Critical Moment
Bitcoin’s price behavior heading into the final days of the year is paradoxical. On the surface, the market appears almost eerily calm. After two consecutive days of minimal volatility, BTC hovered near $88,000, showing little interest in decisive upward or downward movement.
This calm is deceptive. Historically, periods of extremely low volatility at key temporal inflection points—such as year-end or post-halving phases—often precede significant directional moves. The market is not inactive; rather, it is waiting.
From a market-structure perspective, Bitcoin is currently balancing several opposing forces:
- Technical traders are watching longer-timeframe indicators.
- Derivatives markets are unwinding massive positions.
- Institutional capital is preparing for year-end accounting and January reallocation.
- Long-term holders are assessing whether the post-halving bull narrative remains intact.
This convergence makes the current price zone far more significant than its muted day-to-day movement suggests.
2. Derivatives Expiry and the Illusion of Stability
One of the most important short-term suppressors of price action was the expiration of approximately $24 billion in Bitcoin options, the largest on record. Such events frequently generate what traders describe as “liquidity hunts” or “fake-outs,” where price is deliberately pushed into ranges that maximize losses for over-leveraged participants.
In this case, price volatility appeared briefly before being quickly absorbed, reinforcing the perception of stagnation.
However, this does not reflect a lack of interest in Bitcoin. Instead, it reflects mechanical market behavior driven by derivatives settlement. Once these positions clear, the market often regains directional clarity.
For sophisticated investors, this is a reminder that spot price alone does not tell the full story—especially in a market where derivatives volume frequently exceeds spot volume.
3. The Three-Day RSI Divergence: A Subtle but Powerful Signal
While short-term charts appear uneventful, longer-timeframe indicators tell a different story.
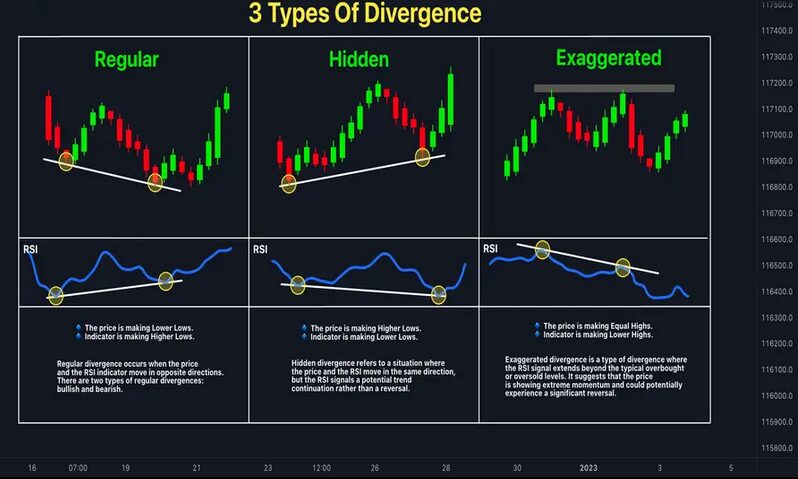
On the three-day chart, Bitcoin is forming a bullish divergence on the Relative Strength Index (RSI). In simple terms, price has made lower lows while RSI has made higher lows—a pattern that often signals weakening selling pressure.
Historically, Bitcoin’s last two major market bottoms were preceded by similar three-day RSI divergences. Traders closely following this metric argue that it reflects structural accumulation rather than speculative buying.
This matters because longer-timeframe divergences tend to favor investors and institutions, not short-term traders. It suggests that capital with longer holding horizons may already be positioning itself quietly.
Insert a three-day BTC/USD chart highlighting RSI bullish divergence.
4. Seasonality and the January Effect
Another bullish argument comes from seasonality. Historically, early January has often been favorable for Bitcoin, particularly following periods of underperformance.
Two mechanisms are commonly cited:
- Tax-loss harvesting reversal
Investors who sold Bitcoin at a loss in December for tax purposes often re-enter positions in January. - Institutional portfolio rebalancing
Funds frequently allocate capital to assets that underperformed in the prior year, especially if their long-term thesis remains intact.
Some traders argue that Bitcoin may remain range-bound for several more days before these forces take effect. If this plays out, a breakout above descending trendlines could open a path toward $100,000, at least temporarily.
While such forecasts should be treated cautiously, they underscore an important point: time, not price, may be the current constraint.
5. Low Volatility as a Feature, Not a Bug
After a strong rally earlier in the year, Bitcoin entered a prolonged range with declining volatility. From a market-cycle perspective, this is not abnormal.
Volatility in Bitcoin has historically moved in waves:
- Explosive expansion phases
- Compression and consolidation
- Pattern resolution and renewed expansion
Periods of low volatility are often frustrating for retail traders, but they are highly productive for systematic strategies, accumulation models, and infrastructure builders.
In other words, a quiet market does not mean a weak market—it often means a market preparing for its next structural move.
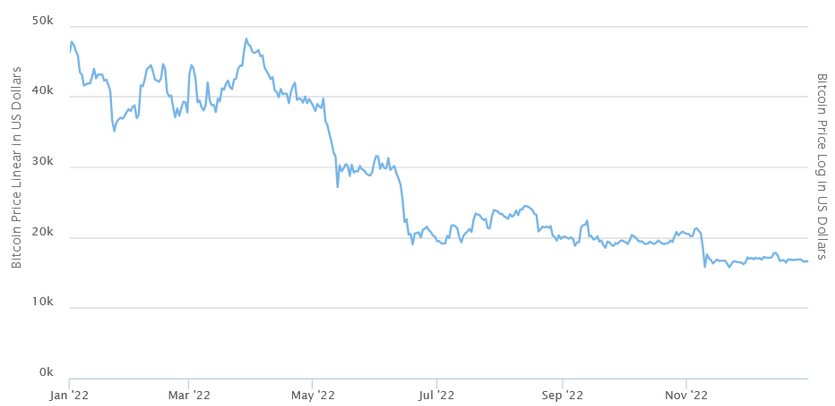
Insert a one-day or one-week BTC chart showing volatility compression.
6. The Yearly Candle: Why the Close Matters More Than the Wick
As the year draws to a close, attention has shifted from intraday price swings to a much higher-level metric: the yearly candle.
Bitcoin is currently down approximately 6% year-to-date. If it closes the year below its opening price (around $93,500), it would mark the first red yearly candle following a halving event.
This would be historically significant for two reasons:
- It would challenge the assumption that post-halving years are reliably bullish.
- It could signal a structural shift in Bitcoin’s maturation as an asset class.
Importantly, many analysts emphasize that the closing price matters far more than intrayear highs or lows. Long wicks above key levels are less meaningful than where the market ultimately settles.
Insert a 12-month BTC chart highlighting yearly open and potential close.
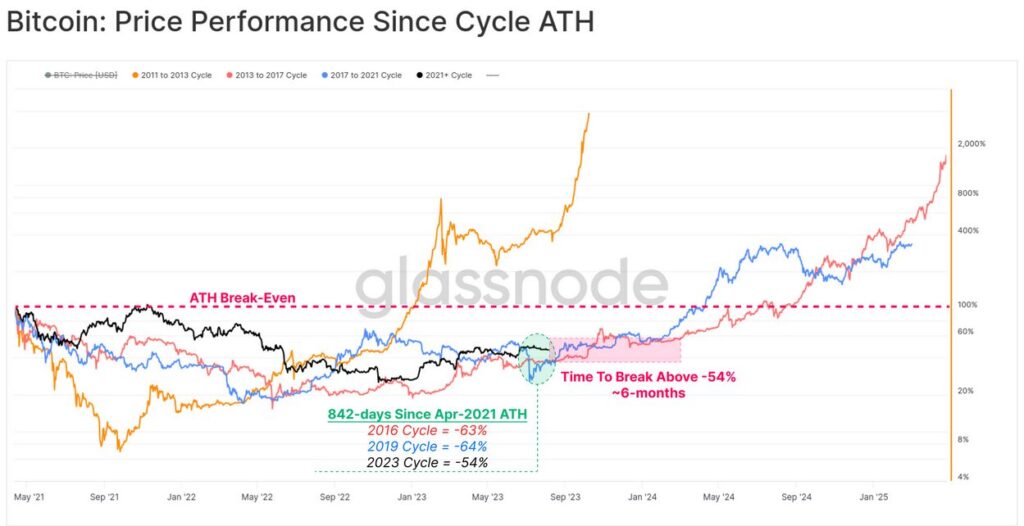
7. Is the Four-Year Cycle Thesis Breaking Down?
For more than a decade, Bitcoin has been widely interpreted through the lens of a four-year halving cycle. According to this model, price appreciation follows a predictable rhythm tied to supply reductions.
However, Bitcoin today is fundamentally different from Bitcoin in earlier cycles:
- Institutional participation is far higher.
- Derivatives markets are deeply integrated.
- Macro factors such as interest rates and global liquidity play a larger role.
- Bitcoin is increasingly treated as a macro-sensitive asset, not a purely crypto-native one.
A red yearly close in a post-halving year would not invalidate Bitcoin’s long-term value proposition—but it would suggest that cycles are elongating, mutating, or overlapping.
For serious investors, this is not a bearish conclusion. It implies that simplistic cycle timing strategies may no longer be sufficient, while long-term conviction and cash-flow-neutral accumulation strategies become more important.
8. Implications for Investors and Builders
For readers seeking new crypto assets, revenue opportunities, or practical blockchain applications, this environment offers several lessons:
- Price stagnation is not inactivity. Capital is reallocating beneath the surface.
- Structural signals often appear on higher timeframes, not intraday charts.
- Bitcoin’s role as collateral, reserve asset, and settlement layer continues to expand regardless of short-term price.
- Businesses and protocols built during low-volatility phases are often best positioned for the next expansion.
Rather than viewing the current market as disappointing, it may be more accurate to see it as transitional.
Conclusion: A Market at the Edge of Reinterpretation
Bitcoin’s pause near $88,000 is less about indecision and more about recalibration. The market is simultaneously digesting post-halving expectations, institutional behavior, derivatives distortions, and macro uncertainty.
Whether Bitcoin closes the year green or red, the more important takeaway is this: the asset is evolving. Its cycles are becoming more complex, its participants more diverse, and its role in the global financial system more pronounced.
For those focused on long-term value creation—whether through investment, infrastructure, or application-level innovation—this moment may be remembered not as a failure to rally, but as the foundation for the next phase of Bitcoin’s maturity.