Main Points :
- Bitcoin is struggling below its 20-day EMA, with $84,000 acting as a critical support that could determine whether the broader downtrend resumes.
- Ethereum remains trapped within a symmetrical triangle, signaling equilibrium but also the potential for a sharp breakout toward $4,000 or a breakdown toward the low $2,000 range.
- XRP is attempting to rebound within a descending channel, yet faces strong resistance at its short-term moving averages.
- Solana shows signs of seller dominance despite rebound attempts, with $116 and $95 emerging as key downside levels.
- Beyond pure chart patterns, macro liquidity conditions, ETF flows, and on-chain activity are becoming decisive factors for the next major move.
Introduction: Technical Analysis Returns to the Center of Crypto Markets
After several weeks of consolidation and failed breakout attempts, major cryptocurrencies are once again at a technical crossroads. Bitcoin, Ethereum, XRP, and Solana are all displaying chart structures that suggest uncertainty, declining momentum, and the possibility that the broader downtrend may resume.
For investors searching for new crypto assets, alternative income opportunities, or practical blockchain use cases, understanding these technical signals is no longer optional. Price structure, moving averages, and support–resistance levels provide critical insight into capital rotation, risk management, and timing—especially in a market increasingly influenced by institutional flows and macroeconomic signals.
This article expands on the original chart analysis by incorporating recent market developments, cross-asset correlations, and on-chain context, offering a deeper, practical interpretation for serious market participants.
Bitcoin (BTC) Price Outlook: A Battle at Key Support
[BTC/USDT Daily Chart with 20-day EMA and Key Support Zones]
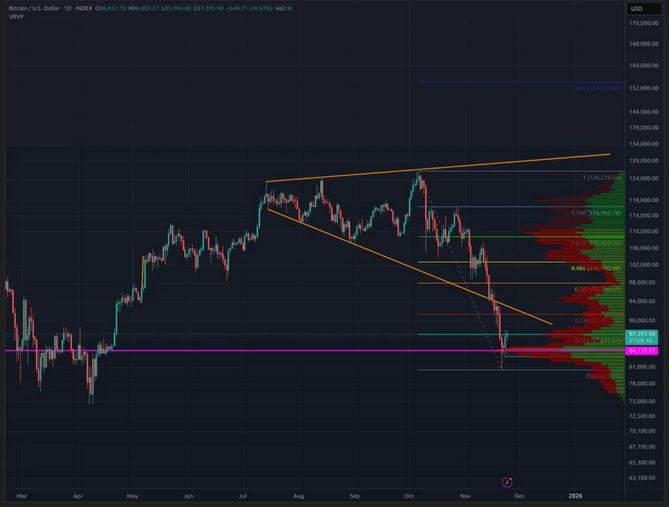
Bitcoin recently pulled back sharply from its 20-day exponential moving average (EMA), currently around $88,593, signaling persistent weakness in market sentiment. This rejection indicates that sellers remain active at higher levels, preventing bullish continuation.
The most critical level to watch on the downside is $84,000. This zone has repeatedly acted as a demand area, and a decisive breakdown would strongly suggest that the broader downtrend is resuming. If this occurs, BTC could fall rapidly toward $80,600, followed by a deeper decline toward $74,508, a level that previously attracted strong buying interest.
On the bullish side, a daily close above the 20-day EMA would indicate renewed demand and could open the door to a wide consolidation range between $84,000 and $94,589. However, for bulls to convincingly regain control, Bitcoin must break and hold above $94,589. Such a move would likely trigger momentum-driven buying toward the psychologically significant $100,000 level.
From a broader perspective, Bitcoin’s technical structure is increasingly influenced by ETF inflows, U.S. dollar liquidity, and expectations around interest rate policy. While long-term adoption remains intact, short- to medium-term price action suggests caution rather than aggression.
Ethereum (ETH) Price Outlook: Compression Before Expansion
[ETH/USDT Daily Chart Highlighting Symmetrical Triangle Pattern]
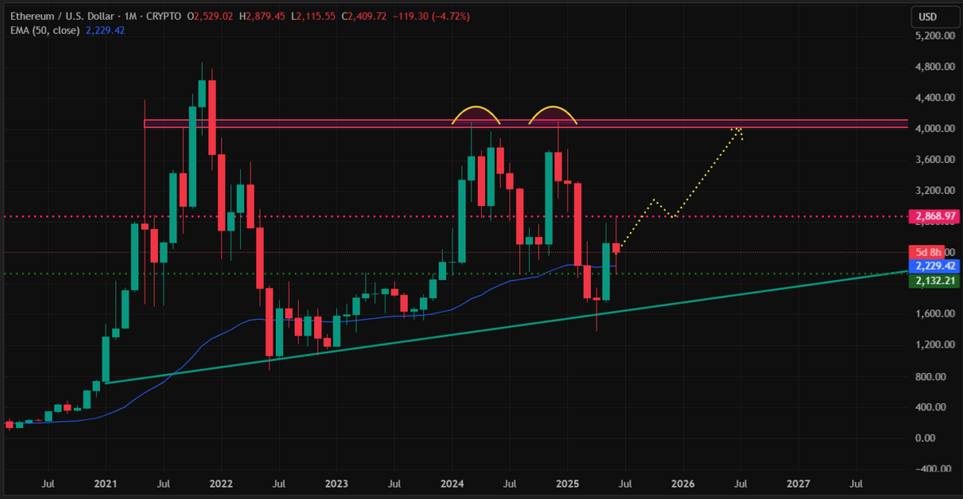
Ethereum continues to trade within a symmetrical triangle, a classic pattern that reflects a balance between buyers and sellers. This compression often precedes a significant directional move, making ETH one of the most technically sensitive assets in the current market environment.
If ETH manages to break above its moving averages, the next target becomes the upper resistance line of the triangle. A confirmed breakout and daily close above this resistance would likely trigger a rally toward $4,000, reinforcing Ethereum’s role as the backbone of decentralized finance, Layer 2 scaling, and tokenized real-world assets.
Conversely, a rejection from current levels followed by a breakdown below the triangle’s support line would indicate bearish dominance. In that scenario, ETH could decline to $2,623, with further downside risk toward $2,373.
Beyond charts, Ethereum’s outlook is tightly linked to network activity, staking dynamics, and Layer 2 adoption. While fundamentals remain strong, price action suggests that the market is waiting for a decisive catalyst before committing capital in size.
XRP Price Outlook: Attempted Reversal Inside a Descending Channel
[XRP/USDT Daily Chart with Descending Channel and Moving Averages]
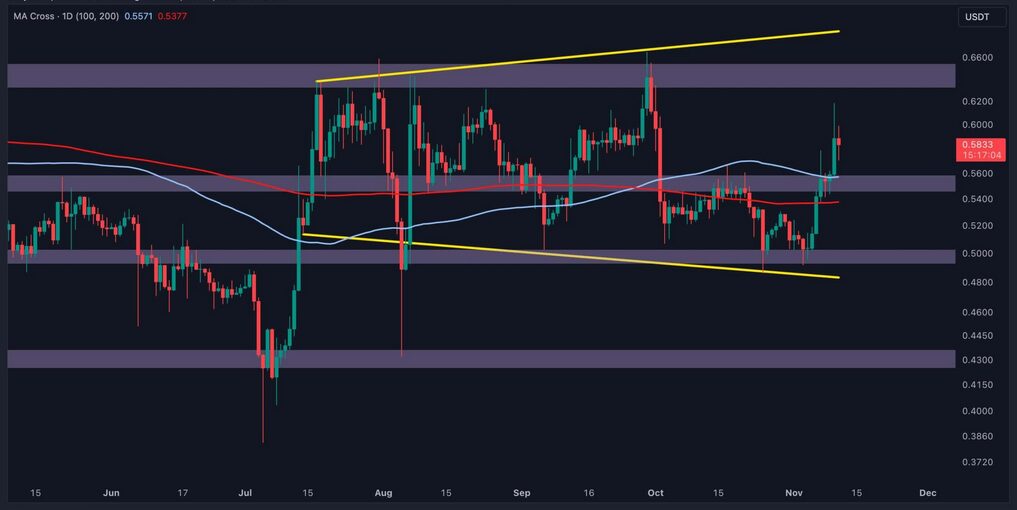
XRP remains confined within a descending channel, a structure that typically reflects sustained selling pressure. However, bulls are attempting to stage a rebound, signaling that downside momentum may be weakening.
To demonstrate strength, XRP must climb above the 20-day EMA at approximately $1.93. A successful move above this level could propel price toward the 50-day simple moving average (SMA) near $2.09, followed by a test of the descending trendline.
Failure to hold current levels, however, would suggest that sellers remain firmly in control. In that case, XRP could revisit its strong support at $1.61. A breakdown below this level would significantly worsen the technical outlook, opening the door to a sharper decline toward $1.25.
From a practical investment standpoint, XRP remains highly sensitive to regulatory developments, cross-border payment adoption, and institutional usage. These factors can amplify technical moves, making disciplined risk management essential.
Solana OL) Price Outlook: Selling Pressure Persists(S
[Insert Chart 4: SOL/USDT Daily Chart Showing Rejection Wicks and Key Levels]
Solana is attempting to rebound, but repeated long upper wicks on candlesticks indicate strong selling pressure at higher levels. This pattern suggests that traders are using rallies as opportunities to exit positions.
If SOL breaks below $116, it would signal a continuation of the downtrend. In that case, price could slide toward $108, with the next major support located at $95. This level represents a critical zone where long-term buyers may re-enter.
The first bullish signal would be a daily close above the 20-day EMA at around $127, which would suggest diminishing seller control. From there, SOL could advance toward the 50-day SMA near $135, and potentially extend gains toward $147.
Solana’s broader narrative—high-performance blockchain infrastructure, DeFi activity, and consumer applications—remains compelling. However, current price behavior reflects caution and reduced risk appetite.
Broader Market Context: Why These Levels Matter Now
Across all four assets, a common theme emerges: compression, hesitation, and declining momentum. This environment often precedes sharp directional moves, especially when combined with macro catalysts such as monetary policy shifts, ETF inflows, or regulatory announcements.
For readers seeking new crypto assets or income opportunities, this phase is less about chasing upside and more about preparation—identifying high-probability levels, understanding downside risk, and positioning capital strategically.
Conclusion: Patience Before the Next Major Trend
The current technical landscape suggests that the cryptocurrency market is at a decisive inflection point. Bitcoin’s struggle below key moving averages, Ethereum’s tightening triangle, XRP’s channel-bound recovery attempts, and Solana’s persistent selling pressure all point to unresolved tension.
Whether the downtrend resumes or a new bullish phase emerges will depend on how price reacts at the clearly defined levels discussed above. For disciplined investors and blockchain practitioners, this is a period to observe carefully, refine strategies, and prepare for decisive action when the market reveals its next direction.


