Main Points :
- Bitcoin’s sharp $3,000 intraday rally and subsequent crash in December 2025 was not driven by excessive leverage
- Futures funding rates and open interest data indicate risk reduction, not speculation
- The real drivers were thin order books, concentrated option positioning, and structural sell pressure
- Over 6.7 million BTC are currently held at a loss, creating persistent overhead resistance
- Dealer gamma hedging ahead of option expiry is pinning price within a narrow range
- Without sustained spot demand, Bitcoin may remain range-bound despite headline volatility
Introduction: A Market That Moves Violently—But for the Wrong Reasons
On December 17, 2025, Bitcoin (BTC) experienced a dramatic price movement that captured the attention of traders worldwide. Within less than an hour, BTC surged by nearly $3,000, briefly reclaiming the $90,000 level, only to reverse sharply and fall to approximately $86,000 shortly thereafter.
At first glance, this kind of violent swing appears to be a textbook case of leverage-driven liquidation cascades—a familiar narrative in crypto markets. However, a deeper examination of on-chain data, derivatives metrics, and market microstructure tells a very different story.
According to recent analysis by Glassnode and corroborated by broader derivatives market indicators, this episode was not caused by runaway leverage. Instead, it reflects a far more subtle and arguably more dangerous condition: a liquidity trap embedded within Bitcoin’s current market structure.
This article explores why Bitcoin’s volatility is being misdiagnosed, how structural liquidity constraints are shaping price action, and what this means for investors seeking new crypto assets, revenue opportunities, and practical blockchain applications.
1. Why Leverage Was Not the Cause
Contrary to popular belief, the data does not support the idea that leverage excess triggered the move.
Futures Market Signals Tell a Calm Story
- Perpetual futures open interest (OI) has been declining from cycle highs
- Funding rates across major exchanges remain close to neutral
- Post-FOMC implied volatility actually contracted, rather than expanding
These indicators collectively suggest that traders were de-risking, not aggressively adding exposure.
If leverage were the main driver, we would expect:
- Rising OI
- Positive funding spikes
- Volatility expansion
None of these conditions were present.
Instead, the market was structurally fragile—primed to move sharply even on modest flows.
2. Thin Order Books: The Hidden Accelerator
One of the most critical yet overlooked factors behind Bitcoin’s recent price swings is order book thinness.
Liquidity Is Not Volume
While headline trading volume may appear healthy, depth at key price levels is historically low. This means:
- Fewer resting bids and asks
- Larger price impact from relatively small market orders
- Increased susceptibility to stop-loss cascades even without leverage
[“Bitcoin Order Book Depth vs Price Impact”]
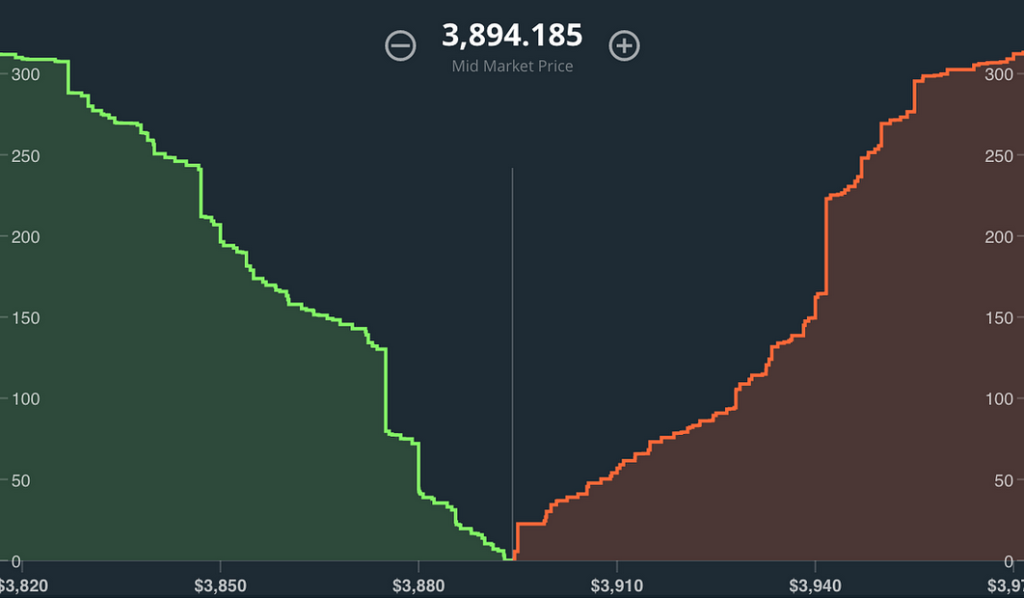
In such an environment, even a single institutional-sized order can create an outsized move—mistakenly interpreted as “whale activity.”
3. The Overhang: 6.7 Million BTC Held at a Loss
Another structural constraint comes from unrealized losses across the network.
Glassnode data indicates:
- Average short-term holder cost basis: ~$101,500
- Significant loss concentration between $93,000 and $120,000
- Approximately 6.7 million BTC are currently underwater
This creates a powerful supply dynamic:
Every rally becomes an opportunity to sell into strength.
[“Bitcoin Supply in Profit vs Loss (USD)”]
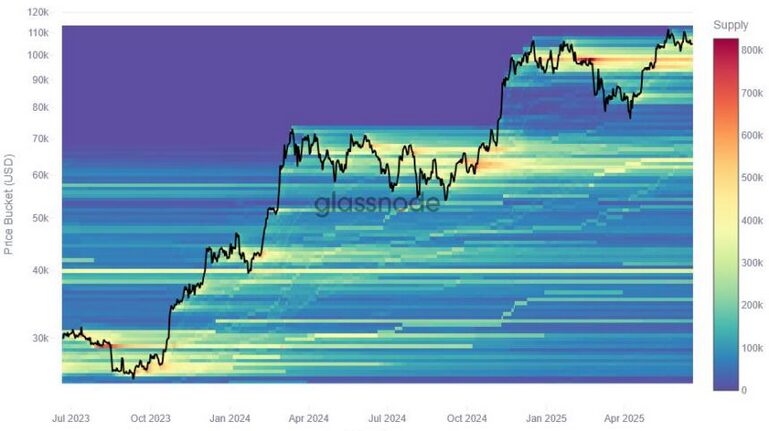
Rather than fueling upside momentum, price increases trigger defensive selling, capping rallies and reinforcing range-bound behavior.
4. Options Market: The Invisible Price Anchor
Perhaps the most underappreciated force in the current market is options positioning, particularly ahead of the December 26 expiry.
Dealer Gamma and Price Suppression
As large option expiries approach, dealers engage in gamma hedging:
- Buy BTC when price falls
- Sell BTC when price rises
This behavior mechanically dampens volatility while simultaneously pinning price within a defined range.
Current estimates suggest a dominant range between:
- $81,000 (lower bound)
- $93,000 (upper bound)
[“BTC Options Open Interest & Gamma Exposure”]
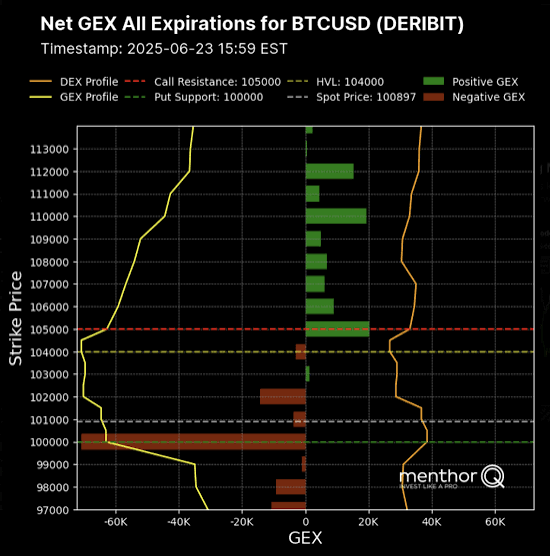
This explains why Bitcoin can appear volatile intraday yet fail to establish a meaningful trend.
5. The Absence of Persistent Spot Demand
Perhaps most critically, spot market demand remains inconsistent.
- Retail accumulation is sporadic
- Corporate treasury purchases are limited
- No systematic buyer steps in during drawdowns
Unlike previous cycles, there is no structural bid supporting price during declines.
This lack of conviction buying means:
- Breakouts lack follow-through
- Rallies fade quickly
- Volatility feels chaotic rather than directional
6. Why This Matters for Investors and Builders
For readers seeking:
- New crypto assets
- Next revenue streams
- Practical blockchain use cases
This environment carries important lessons.
Volatility Without Trend Is a Warning Sign
Markets dominated by liquidity traps are:
- Difficult to trade directionally
- Unforgiving to leverage
- Prone to false signals
Opportunities may instead lie in:
- Market-neutral strategies
- Options structures
- Infrastructure and settlement layers
- On-chain liquidity tooling
Understanding market structure is no longer optional—it is a prerequisite.
Conclusion: Bitcoin Is Not Overheated—It Is Constrained
Bitcoin’s recent violent price swings are not evidence of speculative excess, but rather symptoms of a market caught in a structural liquidity trap.
Thin order books, massive unrealized losses, option-driven gamma suppression, and weak spot demand collectively create an environment where price moves sharply—but goes nowhere.
Until these structural constraints are resolved, Bitcoin is likely to remain range-bound, frustrating trend traders while rewarding those who understand microstructure.
The real risk is not leverage.
The real risk is misreading the market’s true condition.