Key Takeaways :
- Bitcoin has fallen to the $85,000–$86,000 range after losing the critical $88,000 support, triggering over $615 million in leveraged liquidations.
- Despite short-term selling pressure, long-term institutional players—including Strategy, American Bitcoin, and El Salvador—have accumulated more than $1 billion worth of BTC during the downturn.
- On-chain indicators suggest early-stage whale accumulation, though downside risk toward $80,000 remains unless BTC can reclaim key moving averages.
1. Bitcoin Breaks Below $88,000 as Liquidations Accelerate
Bitcoin experienced a sharp sell-off on December 15, falling to approximately $85,600 after decisively breaking below the psychologically and technically important $88,000 support level. This decline marked the lowest price level in roughly two weeks and was accompanied by a wave of forced liquidations in the derivatives market.
According to Coinglass data, more than 180,000 traders were liquidated within a 24-hour period, with total liquidations exceeding $615 million. The majority of these liquidations came from overleveraged long positions, highlighting the fragility of bullish sentiment after Bitcoin failed to sustain a breakout above $95,000 following the most recent FOMC meeting.
On-chain metrics reinforce the view that this drawdown was primarily driven by short-term holders and leveraged traders rather than long-term investors. CryptoQuant’s exchange netflow data shows that Bitcoin recorded net inflows for three consecutive days, totaling over 3,000 BTC—equivalent to approximately $265 million at current prices. Rising exchange balances between December 12 and December 15 suggest that many market participants moved BTC onto exchanges with the intent to sell, amplifying downside pressure.
[Illustrative BTC Price Movement and Key Support Levels]
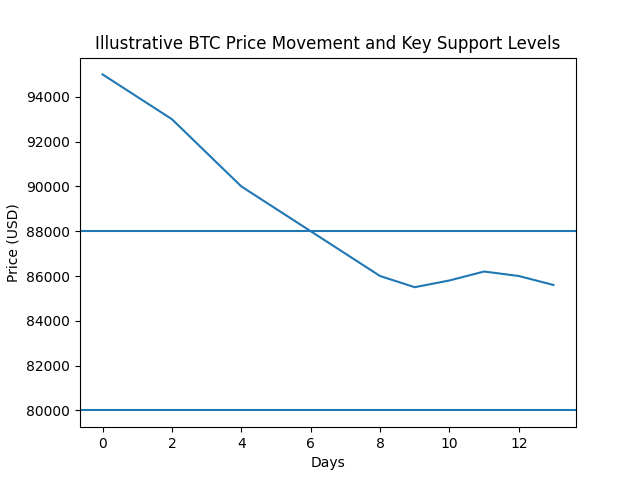
This combination of increased exchange inflows and cascading liquidations created a feedback loop, accelerating Bitcoin’s decline toward the mid-$85,000 region.
2. Institutional Conviction: $1 Billion in Strategic Bitcoin Purchases
While short-term traders capitulated, long-term-oriented institutions moved decisively in the opposite direction. Strategy (formerly MicroStrategy), American Bitcoin, and the government of El Salvador collectively purchased more than $1 billion worth of Bitcoin during the recent dip, underscoring a growing divergence between speculative and strategic capital.
Strategy: Doubling Down on Digital Treasury Assets
Strategy, the largest publicly known corporate holder of Bitcoin, added 10,645 BTC for approximately $980 million—its largest purchase since July. This brings the company’s total acquisitions for the month to 21,268 BTC. CEO Michael Saylor reinforced the firm’s long-term conviction with a characteristically cryptic post on X, signaling continued confidence in Bitcoin as a superior treasury reserve asset.
Strategy’s actions reflect a broader thesis: short-term volatility is irrelevant when Bitcoin is viewed as a multi-decade store of value and inflation hedge. By systematically accumulating BTC during periods of market stress, the company effectively acts as a volatility absorber.
American Bitcoin: Mining, Holding, and Political Alignment
American Bitcoin, a U.S.-based mining and holding company known for its pro-Trump stance, also increased its exposure by purchasing an additional 261 BTC, bringing its total holdings to 5,044 BTC. This places the company among the top 25 corporate Bitcoin holders globally.
The firm’s strategy blends mining operations with opportunistic spot accumulation, allowing it to expand holdings both organically and through market purchases. Its behavior during the downturn suggests confidence that current prices represent long-term value rather than systemic risk.
El Salvador: Steady Accumulation as National Policy
El Salvador continues to execute its daily Bitcoin purchase policy, pushing its national reserves above 7,500 BTC, valued at over $670 million. Unlike corporate buyers, El Salvador’s accumulation is explicitly policy-driven, reflecting a long-term bet on Bitcoin’s role in sovereign finance and monetary independence.
Notably, on-chain transaction data reveals whale-sized purchases consistent with these disclosures. CryptoQuant reports that the spot average order size turned positive at 1.1 BTC on December 15—its first whale-dominated reading since November 25.
[Illustrative Liquidations vs Whale Accumulation Index]
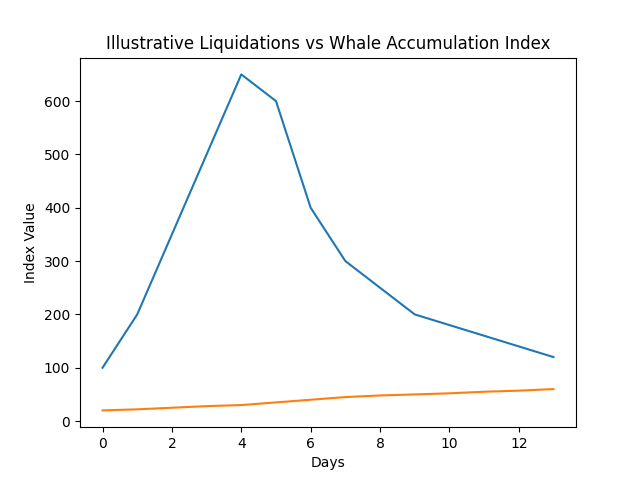
3. On-Chain Signals: Early Signs of Whale Accumulation
Beyond headline purchases, on-chain indicators suggest that broader whale activity may be quietly increasing. Average order size, exchange withdrawal patterns, and declining sell pressure from long-term holders all point toward early-stage accumulation.
Historically, similar patterns have emerged near local bottoms, where leveraged participants are forced out while patient capital builds positions. However, these signals are still preliminary. Confirmation typically requires sustained exchange outflows and a recovery above short-term moving averages.
4. Technical Outlook: Can Whale Demand Defend $80,000?
From a technical perspective, Bitcoin remains under pressure. On the weekly chart, price is trading below both the 20-week and 50-week moving averages, indicating a bearish intermediate-term structure. The Parabolic SAR remains above price, reinforcing the prevailing downtrend bias.
The Relative Strength Index (RSI) hovers around 36, approaching oversold territory but not yet flashing a decisive reversal signal. Bollinger Bands show BTC trading near the lower band around $82,600, highlighting this zone as a critical area of support.
Breakout probability models currently assign a 54.44% likelihood to further downside continuation, compared to a 33.33% probability of a bullish recovery. Failure to reclaim $88,000 could open the door to a deeper retracement toward $80,000. Conversely, a weekly close above $92,000 would significantly improve the odds of a rebound toward $100,000 and the major resistance zone around $106,000–$107,000.
5. Broader Market Context: Why Whales Are Buying the Dip
Beyond charts and flows, macro and structural factors help explain why whales are stepping in. Bitcoin ETFs continue to normalize institutional access, sovereign adoption narratives remain intact, and long-term supply dynamics—particularly post-halving issuance—support scarcity-based valuation models.
For investors focused on discovering new digital assets or revenue opportunities, this environment reinforces an important lesson: volatility often represents opportunity for those with longer time horizons and robust risk management frameworks.
Conclusion: Strategic Capital vs Speculative Leverage
The current Bitcoin market illustrates a familiar but critical dynamic. As speculative leverage unwinds and prices test key support levels, strategic capital is quietly accumulating. Strategy, American Bitcoin, and El Salvador’s combined $1 billion purchase is not merely a headline—it is a signal of conviction from actors who view Bitcoin as infrastructure, not a trade.
In the near term, downside risk toward $80,000 cannot be dismissed. However, if whale accumulation persists and Bitcoin can reclaim key moving averages, the recent sell-off may ultimately be remembered as another consolidation phase within a broader secular uptrend.
For practitioners and investors alike, the message is clear: understanding who is buying—and why—matters far more than short-term price noise.