
Main Points :
- Bitcoin struggles to maintain support at $93,000, facing strong selling near $100,000.
- Ethereum trades below the key $3,350 breakdown level, with risk of a deeper fall toward $2,500.
- XRP continues its decline within a falling channel, with support near $2.15 becoming fragile.
- Solana trends lower toward the critical $126 support, with downside risk toward $95 if it breaks.
- Market sentiment remains defensive as sellers dominate short-term momentum across major assets.
- Broader macro uncertainty and ETF inflows stagnation add pressure, while long-term accumulation trends remain intact for institutional investors.
Market Overview
The broader cryptocurrency market continues to face persistent bearish pressure as major assets struggle to maintain their respective support zones. While long-term fundamentals remain intact—particularly in institutional adoption, ETF flows, and global regulatory clarity—the short-term price action signals a market dominated by defensive sentiment. This article analyzes the latest technical structures for Bitcoin, Ethereum, XRP, and Solana, and integrates additional insights based on recent global market movements.
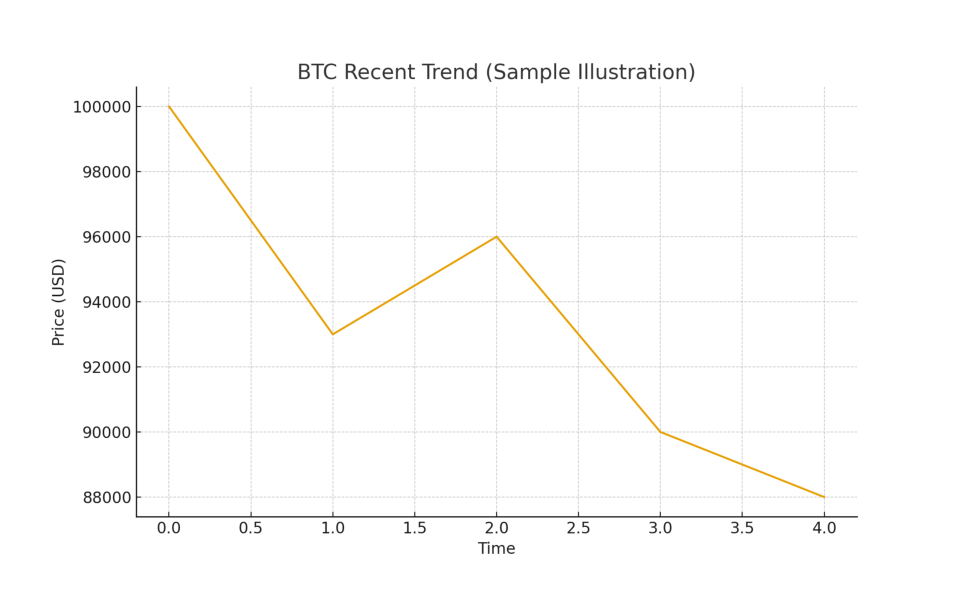
1. Bitcoin (BTC) – Sellers Remain in Control Below $100,000
Current Technical Structure
Bitcoin is attempting to secure support near $93,000, but the lack of a clear rebound shows that sellers remain firmly in control. This price behavior demonstrates bearish commitment despite previous attempts by buyers to defend the psychological level.
Even if BTC attempts a rebound, the $100,000 level is expected to attract significant selling due to its psychological importance. Should Bitcoin fail to reclaim that level decisively, it would convert the range into a new resistance zone, likely triggering a decline toward $87,800 and potentially $83,000.
Key Indicators
- 20-day EMA: $102,022
- 50-day SMA: $109,927
For bullish traders, time is running short. Bitcoin must break and hold above the 20-day EMA, which would weaken the bearish momentum and open the door to a rally toward the 50-day SMA. A successful rally above the 50-day SMA would mark the early stages of a trend reversal.
Recent Global Developments Affecting BTC
Several external factors have amplified the bearish pressure:
- ETF inflow stagnation in the U.S. slowed overall liquidity, reducing upward momentum.
- Bond yield volatility renewed concerns about global liquidity conditions.
- Miners increased BTC selling, responding to post-halving revenue compression.
- Asia markets showed weaker USDT demand, often a precursor to slow spot buying activity.
Still, long-term institutional flows remain intact. Major financial firms continue accumulating BTC for ETF reserves, signaling conviction beyond short-term market noise.
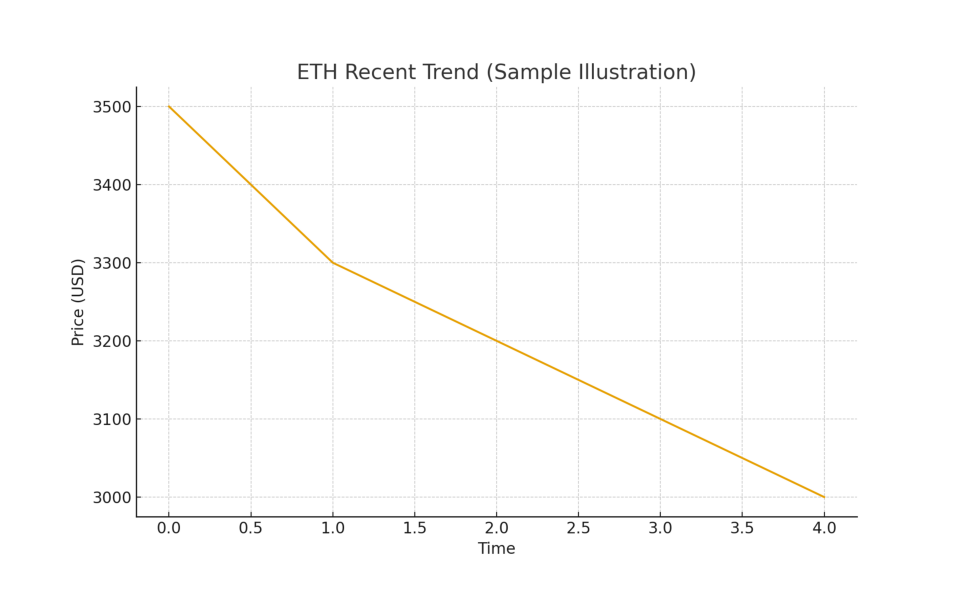
2. Ethereum (ETH) – Struggling Below $3,350 as Bears Defend EMA Levels
Current Technical Structure
Ethereum continues to trade below the crucial $3,350 breakdown level, though bears have so far failed to establish a decisive breakdown below $3,000. This zone has acted as a strong defensive level for buyers.
ETH may attempt a move upward toward the 20-day EMA at $3,444, but sellers are expected to defend this line aggressively. A sharp rejection from the EMA would strengthen the probability of a fall below $3,000, potentially accelerating toward $2,500.
Key Indicators
- 20-day EMA: $3,444
- 50-day SMA: $3,871
If buyers manage to push the price above the 20-day EMA, Ethereum could begin a recovery toward the 50-day SMA. A close above the 50-day SMA would signal the end of the current corrective phase.
Recent Market Context
- ETH ETF applications in the U.S. have slowed, limiting bullish catalysts.
- Layer-2 ecosystems (Arbitrum, Base, Optimism) continue strong growth, but this has not yet translated into ETH spot demand.
- Whale accumulation has cooled but remains net-positive over the past 90 days.
Overall, Ethereum’s long-term fundamentals remain robust, but the short-term chart is clearly controlled by sellers until price reclaims the EMA cluster.
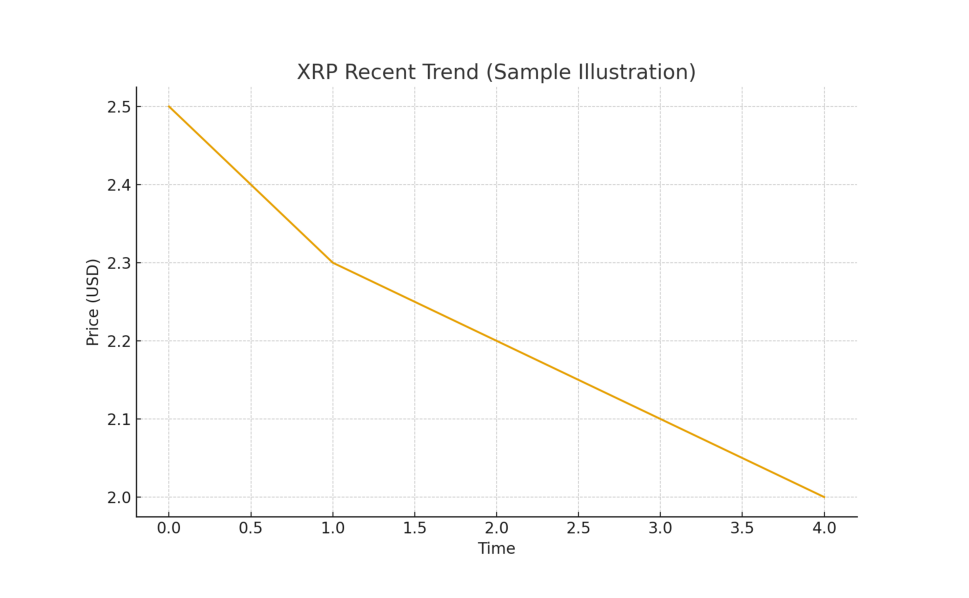
3. XRP – Bearish Channel Dominates as Key Support Weakens
Current Technical Structure
XRP remains locked inside a downward-sloping channel, with sellers continuing to unload their positions during minor bounces. This pattern reflects a classic distribution phase in which every upward attempt is capped by bearish pressure.
A small support zone exists near $2.15, but a breakdown below this level could lead to a swift move toward the lower boundary of the channel. Should XRP fail to hold even that boundary, a deeper decline toward $1.61 is possible.
Upside Conditions
A close above the 50-day SMA ($2.52) would indicate the start of a counter-attack from bullish traders. A genuine short-term trend reversal would only be confirmed after XRP closes above its descending trendline.
Broader Developments
XRP’s macro environment remains a mix of progress and uncertainty:
- The Ripple vs. SEC case is stabilizing, but regulatory resolution remains incomplete.
- Several Asian banks continue testing Ripple’s payment infrastructure.
- On-chain liquidity metrics show reduced retail participation during the downturn.
Market sentiment around XRP remains muted until buyers show significant strength at higher timeframes.
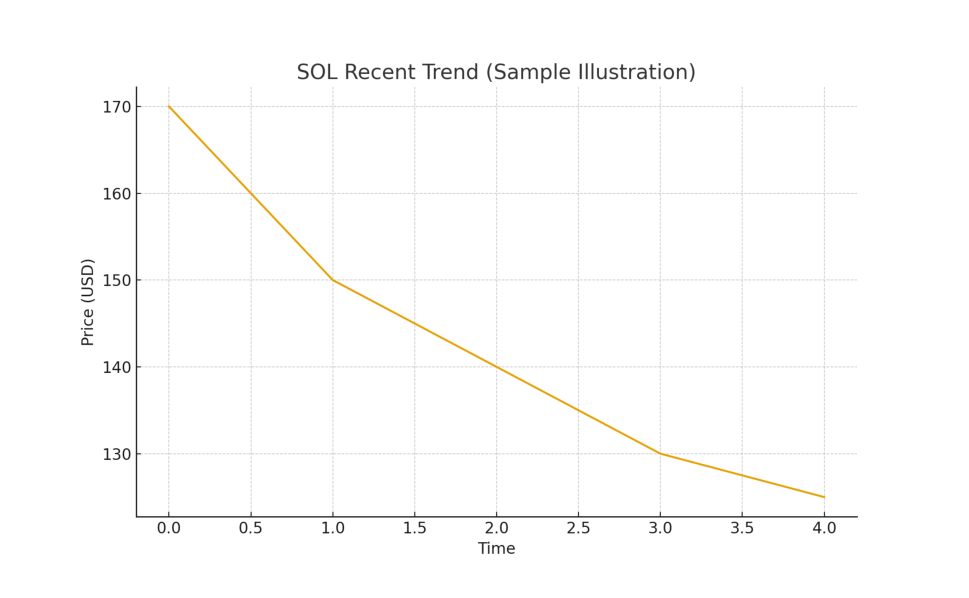
4. Solana (SOL) – Sliding Toward $126 With Risk of a Deeper Breakdown
Current Technical Structure
Solana shows a persistent downward drift toward the major support at $126. The lack of strong recovery attempts indicates that bears continue to dictate short-term direction.
Even if SOL experiences a temporary rebound, selling pressure is expected near the 20-day EMA at $159. A sharp rejection here would increase the likelihood of breaking below $126, which could trigger a decline toward $95.
Recovery Scenario
If buyers successfully reclaim the 20-day EMA, it would indicate strong underlying demand. A move toward the 50-day SMA at $186 would follow, where renewed selling pressure is likely to appear.
Recent Market Context
- Solana’s ecosystem continues expanding, with strong DeFi volume relative to other chains.
- Institutional inflows have weakened but remain higher than most alternative L1 networks.
- Network performance indicators (TPS, stability) remain strong despite price weakness.
Overall, the fundamentals remain healthy, but price action reflects broader market risk-off sentiment.
Conclusion
Across all four major cryptocurrencies—Bitcoin, Ethereum, XRP, and Solana—the short-term momentum remains clearly bearish. Despite solid long-term fundamentals and ongoing institutional adoption, sellers currently dominate the market due to macro uncertainty, stagnating ETF inflows, and seasonal risk reduction among large traders.
These conditions do not necessarily reflect a long-term trend reversal; instead, they represent a consolidation phase often seen after large rallies. Historically, periods of heavy selling pressure have preceded strong accumulation phases, particularly in Bitcoin and Solana.
For investors seeking new crypto assets or practical blockchain applications, this environment highlights two key strategies:
- Monitor macro resistance levels (20-day EMA and 50-day SMA) for signs of momentum shifts.
- Track fundamental developments rather than price alone—such as ecosystem growth, institutional flows, and real-world adoption trends.
The market remains volatile, but long-term opportunities continue to develop beneath the surface.