Main Points :
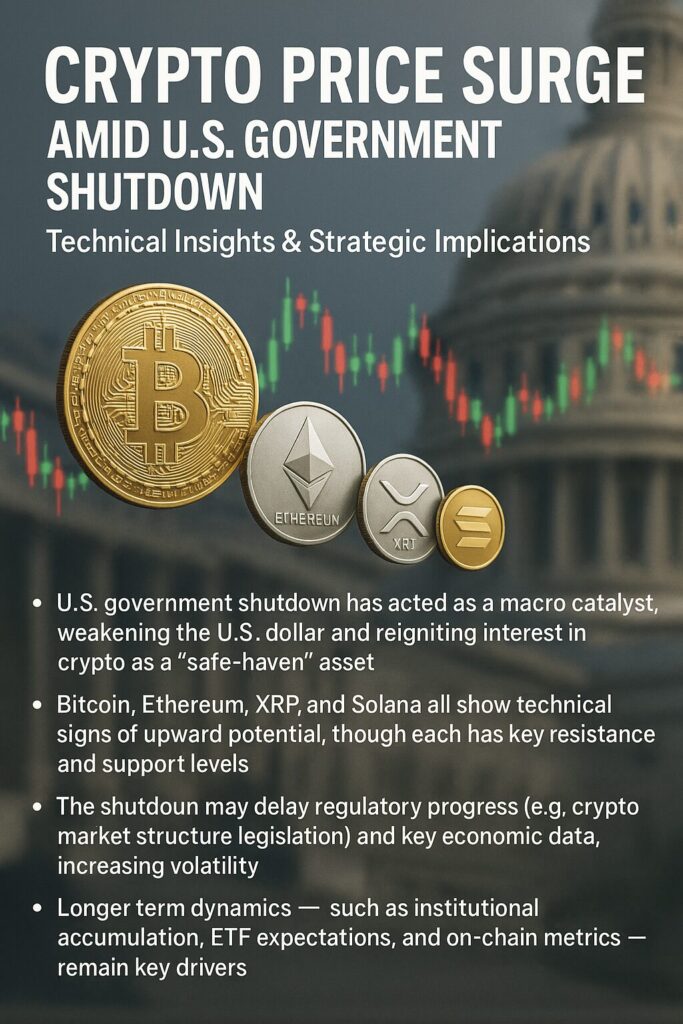
- U.S. government shutdown has acted as a macro catalyst, weakening the U.S. dollar and reigniting interest in crypto as a “safe-haven” asset
- Bitcoin, Ethereum, XRP, and Solana all show technical signs of upward potential, though each has key resistance and support levels
- The shutdown may delay regulatory progress (e.g. crypto market structure legislation) and key economic data, increasing volatility
- Longer term dynamics — such as institutional accumulation, ETF expectations, and on-chain metrics — remain key drivers
- Traders and strategists should monitor both macro developments (inflation data, Fed moves) and chain-level fundamentals
1. Macro Shock as Catalyst: Why Crypto Is Reacting
When the U.S. federal government shuttered operations at the start of October 2025, it introduced an acute macro shock. The dollar weakened, and markets scrambled to reprice risk. Cryptocurrencies—which are often viewed (rightly or wrongly) as hedge or alternative assets—reacted positively in initial responses. For instance, Bitcoin rose ~2.7 %, Ethereum ~3.3 %, Solana ~5.7 %, and XRP ~3.2 % on October 1.
This behavior partly imitates patterns seen in prior shutdowns: in 2013, Bitcoin gained ~14 % during the government shutdown period, though in 2018–19 it lost ~6 %. The effect is neither uniform nor predictable—rather, shutdowns amplify market uncertainty, reduce the flow of key economic data, and shift investor attention toward risk assets.
Importantly, while the shutdown may not directly change blockchain protocols or token mechanics, its indirect effects (via regulation delays, Fed ambiguity, data blackouts) can ripple through market sentiment.
One critical impact is regulatory: the CLARITY Act (or other crypto market structure legislation) may be delayed in Senate debates if Congress is gridlocked.
Thus, traders are navigating a confluence of technical setups and macro uncertainty.
2. Bitcoin (BTC): Breaking Out or Trapped?
Key Technicals
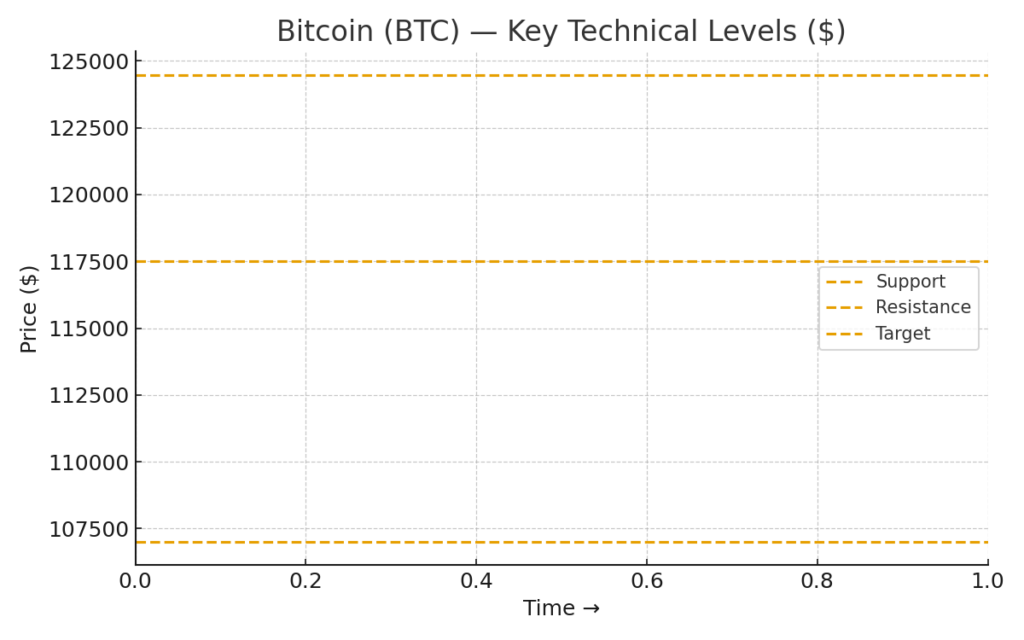
Bitcoin (BTC) recently closed above its moving averages and broke past resistance at $117,500 in some intraday sessions. Its 20-day EMA is turning upward, and the Relative Strength Index (RSI) is above ~61, which suggests upward momentum.
If BTC can close decisively beyond $117,500, the next major resistance is the previous all-time high ~$124,474, and beyond that extension toward $141,948 becomes plausible—though such gains would likely provoke intensified sell-side pressure.
On the downside, a failure to hold support around ~$107,000–$110,000 would weaken the bullish thesis, possibly pushing the price toward $100,000 or lower zones.
Strategic Observations
- Institutional flows and “whale” accumulation remain crucial. Notably, large holders have increased Bitcoin buying in recent weeks.
- The macro angle (dollar weakness, Fed direction) may either amplify or cut short the rally.
- Because BTC has more liquidity and market depth, it tends to lead major upward moves and draw capital into altcoins.
3. Ethereum (ETH): Poised for a Fresh Leg Up
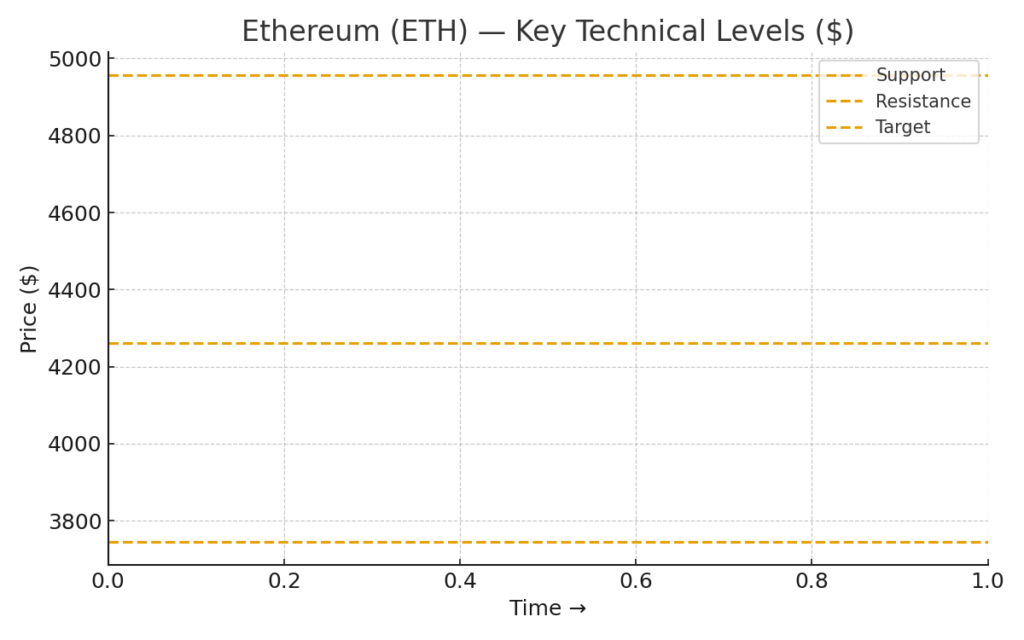
Chart Dynamics
Ethereum’s price is trading above its 20-day EMA (~$4,262), signaling that short-term resistance is weakening. If buyers can push ETH beyond resistance (which could lie near previous highs), the token may re-challenge ~$4,957.
However, a reversal from resistance without a breakout could indicate persistent supply pressure. In that scenario, falling below $3,745 would cast doubt on the short-term uptrend.
Longer-Term Considerations
- ETH is closer (~13.8 %) to its all-time high compared to Solana, giving it an edge in probability for new highs.
- On-chain fundamentals (gas demand, staking yields, protocol upgrades) remain strong supports of ETH’s structural case.
- If crypto-friendly regulation passes, Ethereum is likely to benefit from institutional adoption via DeFi, L2, or staking demand.
4. XRP (Ripple): Triangle Breakout or Breakdown?
Technical View
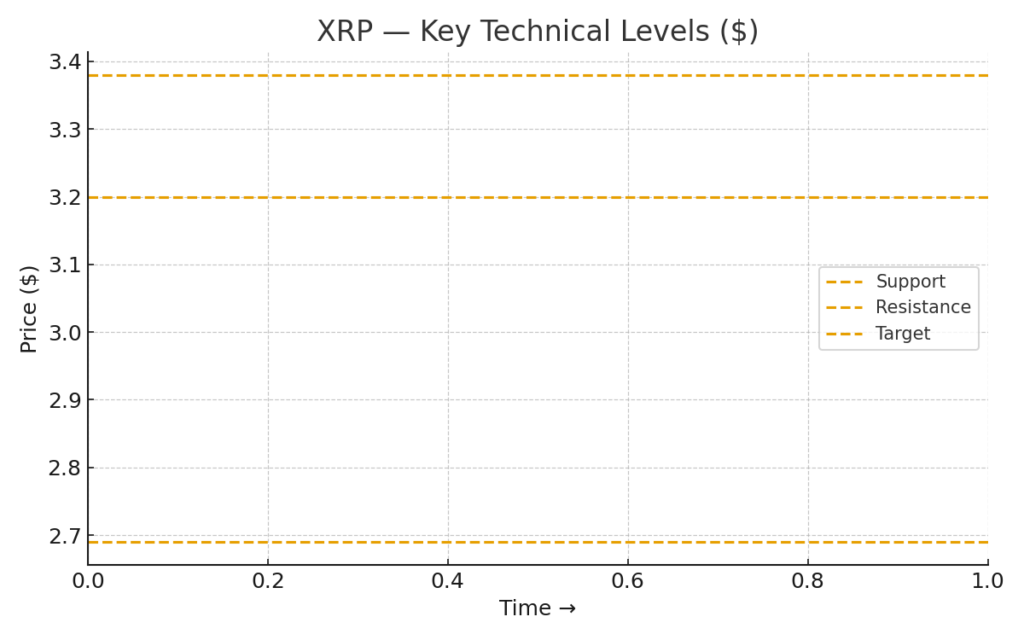
XRP has rebounded off a $2.69 support zone, climbing toward its moving averages. If XRP can close above its descending trendline (i.e., exit the downward triangle), it could re-accelerate toward $3.20, or even $3.38.
Conversely, a failure to break resistance—and particularly a closing below $2.69—would complete a bearish triangle pattern and potentially send prices down toward $2.20.
Broader Context
- Institutional accumulation is a key theme: multiple firms are rumored or reported to be acquiring significant XRP positions.
- Some speculative forecasts (e.g. ChatGPT-based models) project aggressive upside (e.g. $20), though such predictions are highly speculative.
- Regulatory clarity (e.g. SEC treatment, XRP classification) remains a critical unresolved variable that can swing investor sentiment dramatically.
5. Solana (SOL): Recovery Attempt Under Pressure
Price Action
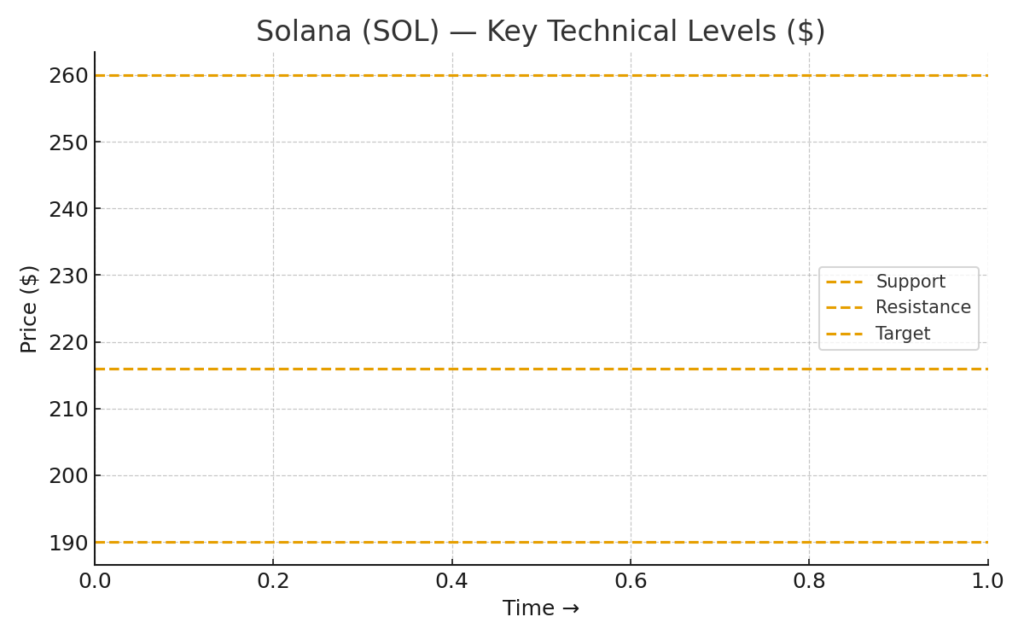
SOL is attempting a recovery, but is encountering resistance near the 20-day EMA (~$216). buyers push through and close above that zone, the next targets lie at $230 and potentially $260.
On the downside, losing support around $190 would threaten a deeper slide toward $175 and indicate a failure of the recovery attempt.
Fundamental Insight
- Solana continues to be attractive for its high throughput and performance in parallel execution. A recent empirical study compared Ethereum and Solana’s transaction conflict patterns and found Solana blocks have longer conflict chains, indicating different concurrency tradeoffs.
- Market sentiment and potential ETF inflows are speculative drivers: some models suggest SOL could finish 2025 between $450–$520 if institutional adoption accelerates.
- However, SOL is further from its all-time high (~34 % down) compared to ETH, reducing its near-term probability of new highs.
6. Charting Strategy: How to Navigate This Regime
Interplay of Macro and Technical
In this environment, technical setups are necessary but not sufficient. The macro overlay—especially the trajectory of the U.S. dollar, interest rate expectations, and regulatory developments—can swiftly amplify or reverse trends. For example, a protracted shutdown eroding economic data flows may introduce false price signals.
Tactical Suggestions
- Use multi-timeframe confirmation: intra-day breakouts above key levels (e.g. Bitcoin above $117,500) may not hold without weekly follow-through.
- Pay attention to volume and institutional flows: signs of accumulation (e.g. on-chain whale moves) often precede sustainable moves.
- Maintain risk buffers: leave room for volatility, especially since legislative or macro surprises may hit.
- Diversify exposure: while BTC and ETH may carry core allocation weight, selected alts (XRP, SOL) can offer outsized upside if their patterns resolve in favor of bulls.
Conclusion
The current U.S. government shutdown is an unconventional catalyst for the crypto market. Its primary influence is through macro channels—dollar weakness, delayed economic data, and regulatory gridlock—rather than any protocol-level shock. Against that backdrop, Bitcoin, Ethereum, XRP, and Solana each present technically intriguing setups, but they are vulnerable to macro reversals.
If the shutdown remains short-lived and regulatory progress resumes, crypto may sustain upward momentum. But if dysfunction drags on, volatility and investor uncertainty could dominate. For asset seekers, this is a moment to balance conviction with flexibility: lean on technical validation, monitor macro headlines closely, and stay attuned to on-chain signs of accumulation or divergence.


