
Main Points :
- Bitcoin has slipped below its 50‑day SMA (~$115,702), yet finds support at the inverse head‑and‑shoulders neckline; resistance near $118,575 could open $120K and ATH re‑test; RSI divergence warns of weakening bullish momentum.
- Ethereum broke below immediate support (~$4,368), with $4,094 key for recovery; if regained, ETH could rise toward $4,788 and $5,000; but breakdown risks deeper pullback to $3,523).
- XRP fails to reclaim 20‑day EMA ($2.94) critical; rebound may test down‑trend line and lead to $3.40–3.66 range; break lower risks $2.73.
- Solana rebounded around $185 (20‑day SMA ~ $182), resistance at $210—break could send it to $240; failure threatens 50‑day SMA (~$172) and lower trend…
- Recent corrections across cryptos: profit‑taking, macro data, central bank signals weigh; Ether rally driven by strong institutional inflows, ETF approvals, regulatory tailwinds.
- Practical implication: Watch key support/resistance zones; institutional capital continues fueling altcoin strength; macroeconomic catalysts like inflation, rate‑cut expectations remain decisive.
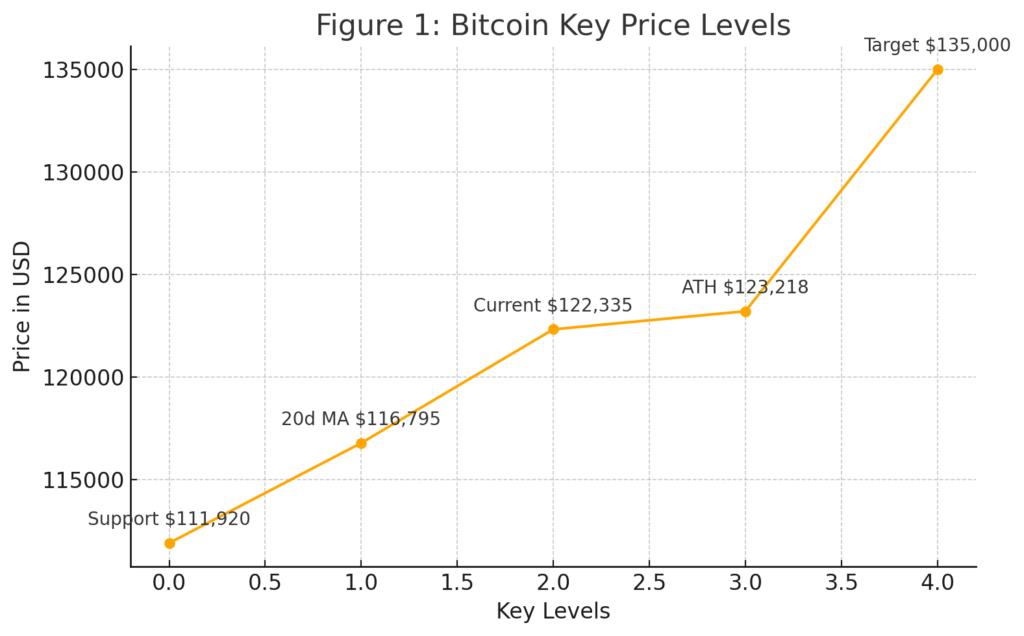
1. Bitcoin Price Outlook
Bitcoin (BTC) recently slipped below its 50‑day simple moving average (SMA) at approximately $115,702, a move that typically signals the beginning of deeper corrections. However, the price is currently being supported at the neckline of an inverse head‑and‑shoulders pattern, offering some stabilization for now.
Should Bitcoin clear the modest resistance around $118,575, it may rally toward the $120,000 mark, and potentially challenge its all‑time high near $124,474. Yet traders must remain vigilant: the Relative Strength Index (RSI) is showing a bearish divergence, suggesting weakening momentum among bulls. If BTC falls below the neckline support, a swift decline to $110,530 is possible—if broken, that may open paths down to $105,000 and even $100,000.
Adding to this caution, broader crypto markets are signaling fading momentum—Bitcoin, Ethereum, and XRP are hovering near critical support levels (~$116K for BTC; ~$2.99 for XRP), while Ether is struggling to breach ~$4,488 resistance.
Globally, today’s pullback across cryptos is attributed to profit‑taking and macroeconomic concerns—Bitcoin fell ~2.3% to ~$115,494, Ether down ~5.2%, XRP ~3.8%, Solana ~6%—driven by U.S. inflation data and upcoming Fed signals.
2. Ethereum Price Outlook
Ethereum (ETH) recently slipped below its near‑term support at $4,368, indicating that short‑term buyers may be cashing in profits. The $4,094 level now represents a crucial pivot: a bounce from there would signal bullish intent, possibly driving ETH toward $4,788, and if that level is broken, even $5,000.
Conversely, if ETH fails to hold above $4,094 at close, this may mark the start of a deeper correction: prices could fall to $3,745, and potentially to the 50‑day SMA around $3,523.
Supporting bullish sentiment, on‑chain analysis from Glassnode shows ETH approaching its all‑time high (~$4,828), within just 3.1%. Standard Chartered and others cite robust institutional treasury and ETF buying, as well as rapid stablecoin adoption, raising its 2025 target to $7,500.
Moreover, recent news shows Ether rallying as part of a “catch‑up trade”: ETH is near its all‑time high (~$4,865.81), up nearly 42% year‑to‑date. Favorable regulations like the Genius Act (stablecoin regulation), the Pectra upgrade boosting efficiency, and booming ETF inflows—especially via BlackRock’s products—are fueling institutional accumulation.
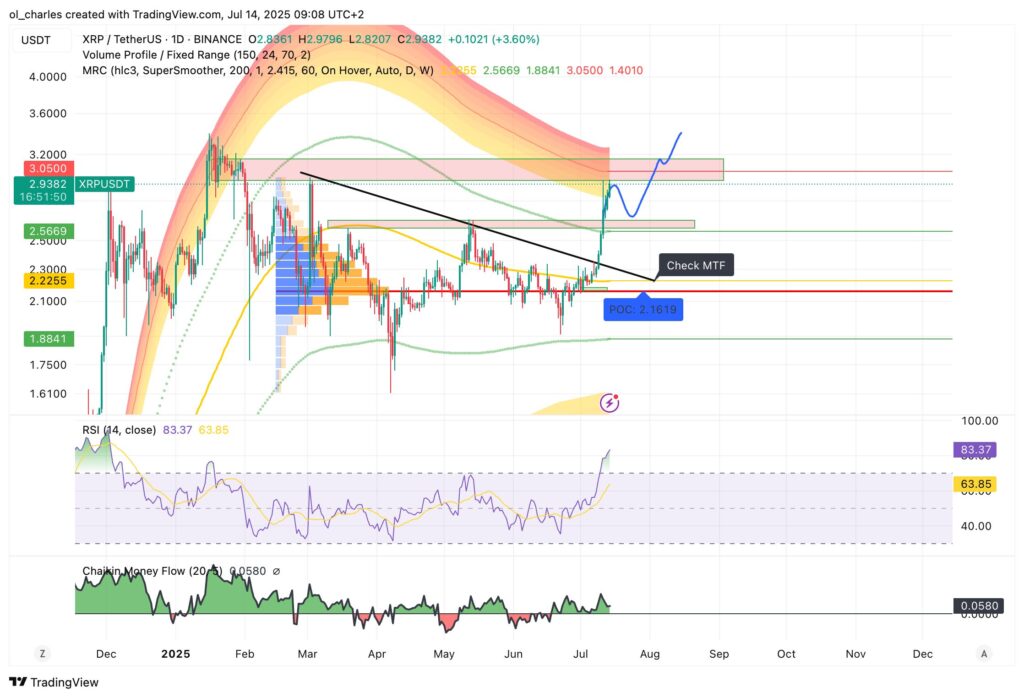
3. XRP Price Outlook
XRP remains pressured below its 20‑day exponential moving average (EMA) around $3.10, suggesting lack of demand at higher levels. The 50‑day SMA near $2.94 may act as critical support; a rebound from here could prompt bulls to test the descending trendline, with upside potential toward $3.40 and then $3.66.
If the 50‑day SMA fails to hold, XRP may slide to $2.73; from that point, a strong rebound could set up consolidation between $2.73‑$3.66.
Traders are increasingly focused on XRP as a top altcoin to consider after recent market corrections. But in the meantime, XRP is tumbling—down about 5% on latest day, briefly dipping below the $3 psychological level—mirroring broader crypto pullback dynamics.
4. Solana (SOL) Price Outlook
Solana (SOL) rebounded near $185, which corresponds to its 20‑day SMA (~$182), though it failed to sustain high levels. Resistance presently lies at $209–210; a successful breakout above that range could push momentum toward $240.
However, a drop below the $185 zone could lead to tight trading between $155 and $209, or even further downside to the 50‑day SMA near $172. Fresh bearish signals are emerging: SOL failed to sustain above $200, broke below its neckline (~$182.89), and is showing on‑chain exchange inflows plus bearish MACD/AO crossovers—all pointing to elevated downside risk.
Meanwhile, relative performance over the past week was notable: SOL gained 30.1%, outperforming BTC and ETH in strength.
Charts/Diagrams (to insert as image files):
Suggested diagrams (insert each below its respective section for clarity):
- Bitcoin: Daily chart with 50‑day SMA ($118,575), RSI divergence; label these. (Insert here)
- Ethereum: Daily chart showing break below $4,368, key level at $4,094, upward targets $4,788/$5,000, support at $3,745 / 50‑day SMA (~$3,523). (Insert here)
- XRP: Chart showing 20‑day EMA ($3.10), 50‑day SMA ($2.94) support, trendline resistance, levels $3.40/$3.66 and $2.73. (Insert here)
- Solana: Chart with 20‑day SMA ($182), 185 rebound, 209‑210 resistance, 50‑day SMA (~$172), bearish indicators flagged. (Insert here)
(Note: please produce them clearly labeled and in USD.)
5. Recent Market Developments & Broader Context
- Profit‑taking & Macroeconomic Signals
Major cryptocurrencies are under pressure due to profit‑taking and uncertain macroeconomic signals. Higher‑than‑expected U.S. inflation readings are raising doubts about imminent Federal Reserve rate cuts, which typically fuel crypto rallies. Furthermore, investors are closely watching Fed Chair Powell’s upcoming remarks at Jackson Hole for hawkish/dovish cues. - Institutional & ETF Momentum
Despite pullbacks, institutional interest persists, especially in Ether. Regulatory moves like the Genius Act, the Pectra upgrade, and supportive SEC posture have helped elevate ETH as a treasury asset. BlackRock’s ETH ETFs are attracting record inflows. This has helped drive alt‑season rotation: in July, altcoins like Ether (+21%) and XRP (+23%) surged, capitalizing on Bitcoin’s plateau near $123K. - Outlook on Bitcoin
Bitcoin recently reached a record high (~$123K) but is now consolidating, potentially near turning points that could lead to either further highs or deeper corrections. Some analysts caution more downside ahead, while others see structural accumulation and support building.
Final Summary
In sum, the crypto market sits at a critical juncture—a delicate balance between correction and renewed breakout. Key levels to watch:
- Bitcoin: $115–116K support threshold; break below may target $105–100K, while above $118K could reignite upward push.
- Ethereum: $4,094 is pivotal; hold sets tone for possible $4,788–$5K; violation risks the $3,745–$3.5K zone.
- XRP: 50‑day SMA near $2.94 must hold; rebound may open $3.40–3.66; failure risks $2.73 range.
- Solana: Holds at $185; clear resistance at $209–210—break may see $240; failing to hold may slip toward $172 or lower.
Recent altcoin strength, driven by institutional inflows, ETF demand, and regulatory tailwinds, offers potential for renewed upside—especially in ETH and XRP. However, macroeconomic risks, especially inflation and rate expectations, are looming and could intensify volatility.
For practitioners exploring new crypto investments, or looking for practical blockchain‑based revenue streams: remain nimble. Pivot strategies around these technical levels, and don’t ignore on‑chain and institutional signals—they may guide the next move in this dynamic landscape.


