
Main Points:
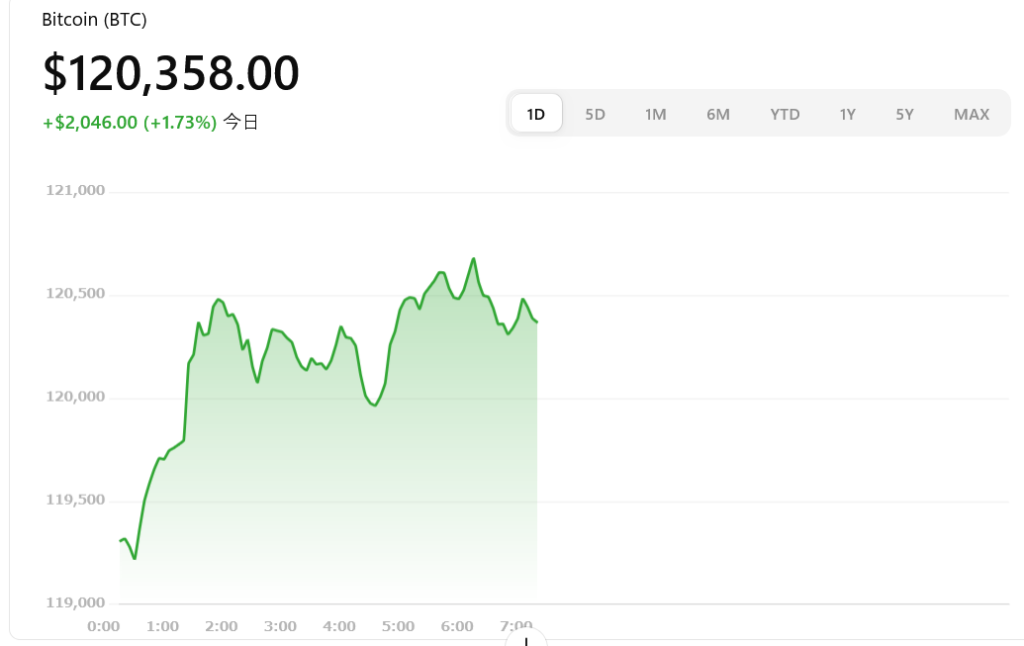
- Bitcoin broke above $120,000, clearing major cost basis clusters and signaling strong support zones.
- On‑chain metrics suggest room for a rally toward $130,000 before demand exhaustion sets in.
- Profit‑taking by long‑term and short‑term holders has accelerated, with $3.5 billion realized in 24 hours.
- Institutional flows into spot ETFs and renewed retail accumulation underpin bullish momentum.
- Elevated risk of short‑term correction as 95 % of investors are holding unrealized gains.
Market Breakout: Clearing Resistance and Establishing Support
In mid‑July 2025, Bitcoin (BTC) shattered its previous all‑time high, surging to $122,600 before briefly retracing to around $118,000. This breakout cleared two critical cost‑basis clusters where investors accumulated between $93,000–$97,000 and $104,000–$110,000, which now stand as formidable support zones.
By breaking these supply shelves, previous resistance levels have been “flipped” into support, giving traders clear reference points should BTC pull back. Market participants will watch whether bids resurface if price revisits the $104,000–$110,000 range.
On‑Chain Indicators: Gauging Demand and Profitability
Glassnode’s July 16 report analyzed several on‑chain indicators, notably the Realized Profit to Loss ratio, which spiked well above two standard deviations before easing. Historically, such spikes precede major market tops as early profit‑taking balances buying pressure. However, sustained accumulation in heavy cost bands suggests that demand remains resilient for now.
The Cost Basis Distribution (CBD) Heatmap shows that a super‑majority of circulating Bitcoin is in profit. With over 95 % of short‑term holders now sitting on unrealized gains, the potential for a rush to protect profits is high, even as long‑term holders continue to accumulate.
Profit Realizations: $3.5 Billion in 24 Hours
On July 16, Bitcoin investors locked in approximately $3.5 billion in profits, one of the largest single‑day realizations of 2025. Long‑term holders (155+ days) claimed about $1.96 billion (56 %), while short‑term holders realized $1.54 billion (44 %) of the total.
This accelerated profit‑taking briefly weighed on price, pulling BTC back from $122,838 to the $118,000 zone. Yet, distribution among smaller retail cohorts (<1 BTC wallets) has begun to shift back toward accumulation, hinting that retail demand is re‑entering the market.
Institutional Inflows: ETFs and Whales Lead the Charge
Following the U.S. approval of multiple spot Bitcoin ETFs in early 2025, Q2 saw over $14.6 billion in net inflows into BTC and ETH products, more than 20× the Q1 figure. This influx has fueled renewed institutional conviction, driving BTC dominance to 64 % of total crypto market cap.
Meanwhile, “whale” activity intensified: Ripple co‑founder Chris Larsen moved $26 million of XRP on‑chain, and large Bitcoin whales resumed accumulation, ratcheting down available supply. Such large orders have contributed to tighter supply dynamics and amplified price swings.
Macro Tailwinds and Regulatory Clarity
Beyond on‑chain dynamics, macroeconomic factors are bolstering Bitcoin’s case as a “flight to quality” asset. Rising geopolitical tensions and persistent inflation concerns have prompted some institutional allocators to diversify into digital gold. At the same time, U.S. regulatory clarity—for example, the passage of the CLARITY Act—has reduced legal uncertainty around cryptocurrency classifications.
Stablecoin supply has also hit new records, exceeding $230 billion, which provides on‑ramps for fresh capital. Monthly stablecoin volumes now surpass $4 trillion, reflecting robust demand for crypto settlements and trading.
Technical Projections: Is $130,000 Next?
Based on historical on‑chain patterns, statistical models indicate that, absent a sudden demand shock, Bitcoin has room to climb toward $130,000 before hitting another major resistance shelf. The $130k level represents the next significant cost‑basis cluster where past demand historically saturated supply.
If BTC reaches that region, short‑term profit‑taking could intensify, potentially leading to a 5–10 % correction. Traders will monitor derivatives funding rates, RSI levels, and open interest for signs of overextension.
Risks and Cautions: Early Overheat Zones
Despite the bullish case, Glassnode warns that market heat metrics are at “initial overheat” levels. The Percentage of Supply in Profit stands near multi‑year highs, while realized volatility is beginning to tick up, often a precursor to corrective phases.
Long‑term holders’ low distribution ratio (high HODLer supply) suggests steadfast support, but a sudden macro catalyst—such as rate‑hike surprises or regulatory setbacks—could trigger rapid liquidations, especially among leveraged futures positions.
Practical Takeaways for Investors
- Establish Clear Entry/Exit Zones: Use the cleared $93k–$97k and $104k–$110k bands as stop‑loss or take‑profit anchors.
- Monitor On‑Chain Heat Metrics: Watch the Realized Profit to Loss ratio and supply in profit percentages to time entries.
- Stay Informed on ETF Flows: Continued inflows may sustain momentum; sudden outflows could signal a shift.
- Diversify Risk: Consider allocation to Ethereum and select altcoins showing strong fundamentals and ETF interest.
- Plan for Corrections: Have a re‑entry plan if BTC dips into support zones amid broader market pullbacks.
Conclusion
Bitcoin’s mid‑July rally past $120,000 reaffirms its position as the leading digital asset, driven by robust on‑chain fundamentals and renewed institutional demand. Statistical models and cost‑basis heatmaps suggest a potential climb to $130,000, yet elevated profit‑taking and overheat indicators warrant prudence. Investors should leverage clear support/resistance zones, monitor ETF flow data, and prepare for short‑term volatility while keeping a longer‑term perspective on Bitcoin’s growth narrative.