
Main Points:
- Strong Price Momentum: ETH reclaimed $2,700 on July 9 after a four-week hiatus, setting sights on the $3,000 psychological mark.
- Altseason Indicators: ETH/BTC correlation is more bullish than in Q2, and the Altcoin Season Index has surged from 11 to 27, hinting at broader altcoin strength.
- Institutional Inflows: CME ETH futures open interest hit a record $3.34 billion, while U.S. spot ETH ETFs have enjoyed eight consecutive weeks of net inflows.
- Technical Setup: ETH has broken above its $2,650–$2,750 resistance zone, trades above key SMAs, and faces low-volume gaps between $3,000–$3,300.
- Risks and Leverage: Rising speculative activity—CME shorts near all-time highs and a 10.6% surge in futures OI on July 8—could precipitate corrections.
1. Recent Price Rebound and Altseason Signals
Ethereum’s resurgence began on July 9, when it closed above $2,700 for the first time in four weeks, reinforcing a bullish market structure and placing the $3,000 level in clear view. Data analysis firm Swissblock highlights that the current ETH/BTC correlation is significantly more bullish than in Q2, a trend often coinciding with the start of an altcoin season. Complementing this, the Altcoin Season Index—measuring the performance of the top 50 altcoins against Bitcoin—jumped from 11 in June to 27 in July, echoing the patterns seen in early 2020 before a major rally.
2. Institutional Demand on the Rise
Institutional interest in ETH has surged. On-chain data from Glassnode indicates that CME Exchange ETH futures open interest (7-day SMA) has reached an all-time high of $3.34 billion as of early July, underscoring growing positioning by large investors ahead of potential upside. Meanwhile, U.S. spot Ethereum ETFs have posted eight consecutive weeks of net inflows, accumulating over 61,000 ETH during that span. This parallel rise in futures OI and ETF flows strengthens the conviction behind the current uptrend .
3. Technical Landscape: Clearing Key Resistance
Ethereum’s chart exhibits a clear bullish structure:
- Resistance Breakout: ETH decisively surpassed the $2,650–$2,750 zone—a barrier rejected multiple times since May—opening the path toward $3,000.
- Low-Volume Gap: Trading volume is historically sparse between $3,000 and $3,300, implying reduced resistance and the potential for a swift push once $3,000 is breached.
- Momentum Indicators: The daily RSI sits above 60, signaling sustained buying pressure, and ETH is trading above its 50, 100, and 200-day SMAs.
Figure 1: Ethereum price trend (June 11th to July 10th, 2025)
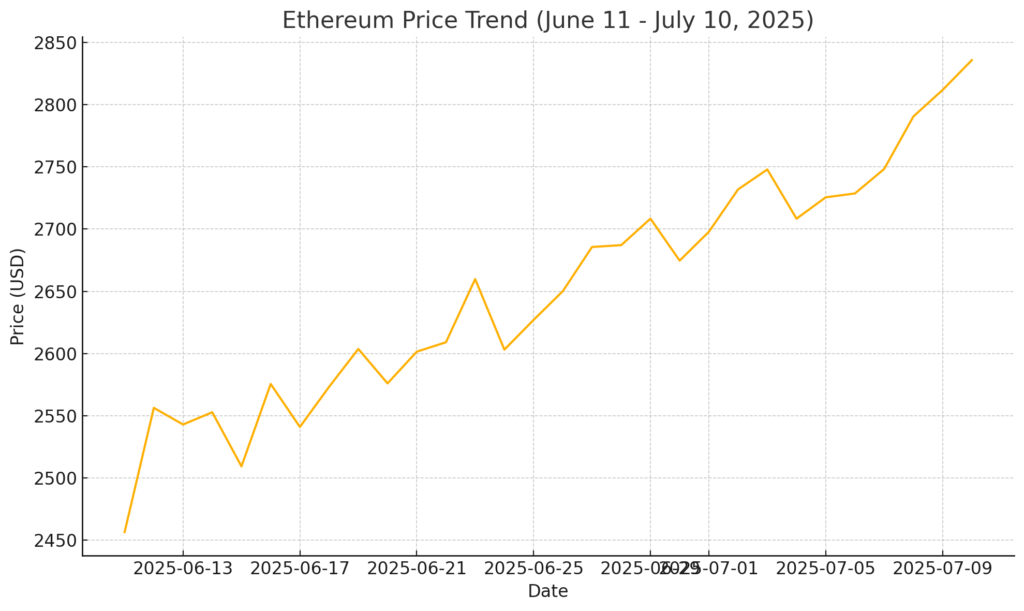
The above chart shows the price trend from June 11th to July 10th, depicting a steady upward trend.
4. Potential Headwinds: Leverage and Sell-Side Risks
- While the setup is bullish, caution is warranted:
- Surging Speculation: On July 8, ETH futures OI rose by over 10.6%, pointing to increased speculative leverage. Historically, 11 of the 13 prior instances with comparable OI spikes resulted in price corrections, according to analyst Maaltun.
- Short Position Spike: Short positions on CME ETH futures recently climbed to the second-highest level ever recorded, suggesting that a short-squeeze could fuel rapid price moves either way.
- Fallback Levels: Failure to hold above $2,750 could lead to sideways consolidation, with potential retracement toward the $2,375 liquidity gap.
5. Broader Market Context and Emerging Trends
Beyond Ethereum, several ecosystem narratives reinforce the bullish thesis:
- DeFi Growth: TVL (total value locked) in major Ethereum L2s and DeFi protocols has grown by 12% in Q2, highlighting ongoing adoption and revenue opportunities for users.
- Regulatory Clarity: Several jurisdictions, including Japan and the U.S., have made positive regulatory strides on spot ETH ETFs, broadening the investor base.
- Protocol Upgrades: Anticipation around the upcoming “Proto-Danksharding” upgrade has amplified narratives around scalability and fee reduction, bolstering long-term fundamentals.
Conclusion
Ethereum stands at a pivotal juncture. The confluence of technical strength, institutional demand, and macro-market trends positions ETH for a potential breakout above $3,000—an event that could usher in a new altcoin season. Yet, elevated leverage and concentrated speculative positions inject volatility risk. Over the next 72 hours—emphasized by Swissblock as a critical gauge—Ethereum’s ability to sustain its bullish momentum will determine whether it can escape a months-long trading range or revert to consolidation. For investors seeking the next crypto opportunity, monitoring these dynamics—price levels, on-chain flows, and leverage metrics—will be essential in navigating the emerging landscape.


