Main Points:
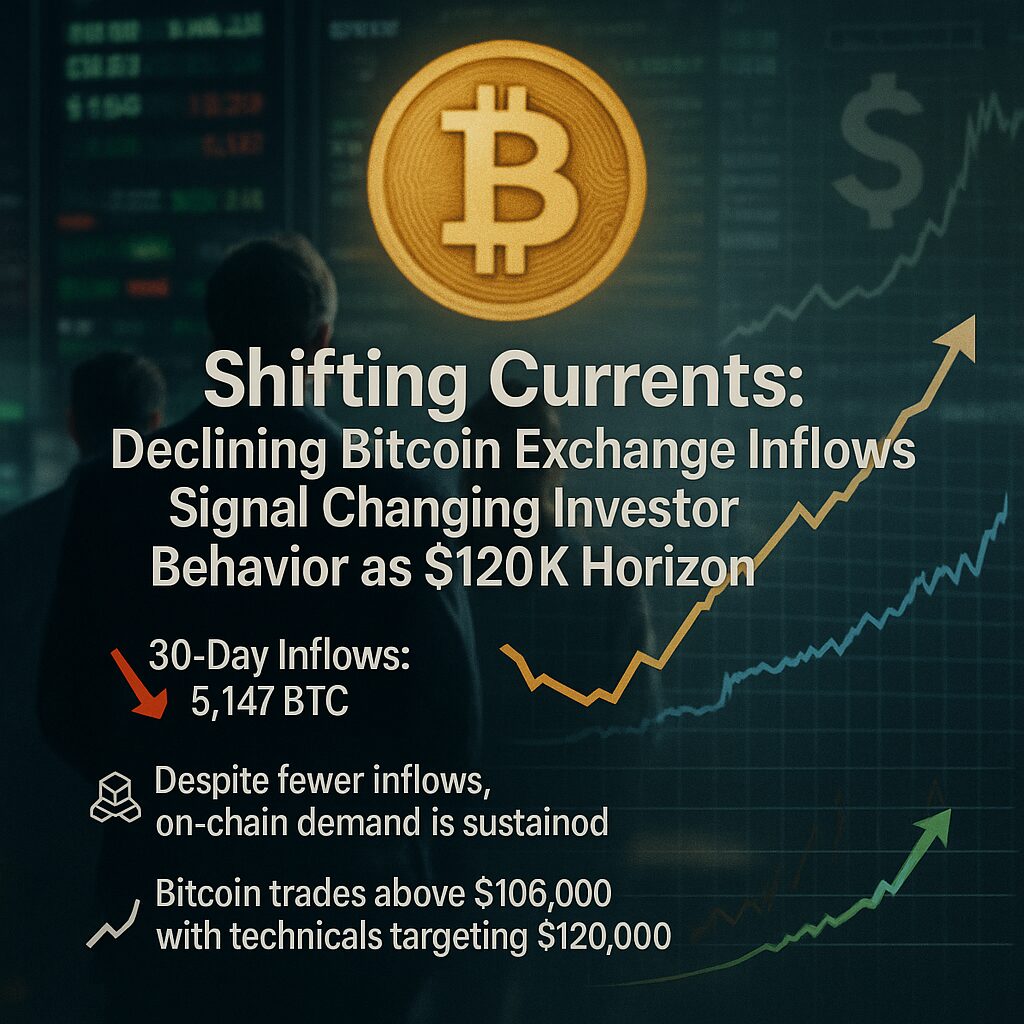
- Binance’s BTC 30-day moving average inflows plunged to 5,147 BTC on June 25, 2025, below the 12,000 BTC average since 2020 and roughly one-third of the 13,200 BTC recorded on December 5, 2024
- Despite fewer inflows, the on-chain inflow/outflow ratio remains near late-2023 highs, indicating sustained demand
- Bitcoin trades above $106,000, with technical indicators—50-day EMA breach and rising cumulative volume delta (CVD)—suggesting a move toward $120,000
- Institutional adoption accelerates: spot ETFs hold over 1.2 million BTC (≈$133 billion), and investors like Philippe Laffont foresee a $5 trillion market cap
- Macro tailwinds—easing geopolitical tensions and a weakening U.S. dollar—enhance Bitcoin’s appeal as a hedge and yield diversifier
- Practical implications for investors include reduced sell-pressure, extended holding periods, and emerging opportunities in DeFi and layer-2 scalability.
Exchange Inflows Plunge: A Bearish Signal or Bullish Contrarian?
Binance’s Bitcoin inflows—tracked via the 30-day moving average (30-DMA)—have historically spiked near market peaks as investors rush to exchanges to sell. On June 25, 2025, this metric fell to just 5,147 BTC, less than half of its post-2020 average of 12,000 BTC and roughly one-third of the 13,200 BTC recorded when BTC was below $100,000 on December 5, 2024.
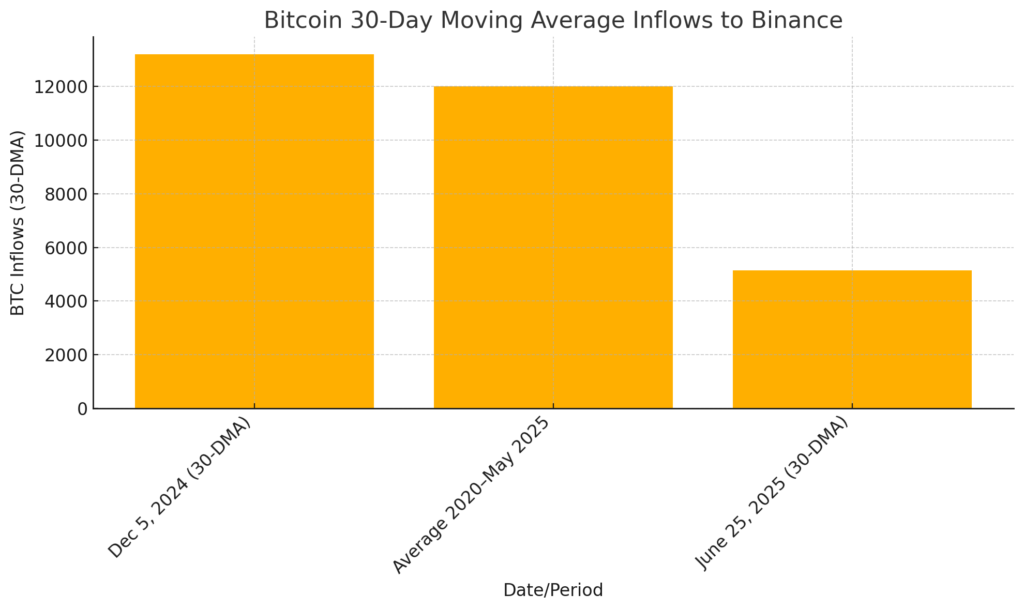
As illustrated in Figure 1, this dramatic decline suggests that holders are choosing to retain rather than liquidate, pointing to decreased sell-pressure. Historically, such sustained low exchange inflows can precede extended bull runs, as seen after mid-2020’s low-volatility consolidation.
On-Chain Demand Remains Strong
While outright inflows have dropped, the inflow/outflow ratio—a gauge of net exchange demand on a 30-day simple moving average basis—remains elevated at levels comparable to the end of 2023’s bull-market inception. This indicates that even with fewer coins entering exchanges, withdrawals (outflows) are robust, reflecting strong accumulation by long-term holders.
Price Action and Technical Outlook
Bitcoin’s price consolidation above $106,000 on June 25, 2025, coincided with renewed interest from traders and “whales,” driving momentum higher. Two technical indicators bolster the bull case:
- 50-Day Exponential Moving Average (EMA): After dipping below the 50-day EMA during the recent correction, BTC reclaimed this level for three consecutive closes, a pattern historically followed by 10–20% breakouts toward new highs.
- Cumulative Volume Delta (CVD): Spot CVD has climbed steadily, signifying persistent buy-side pressure in the spot market. This metric’s ascent amid sideways price action underscores underlying bullish sentiment.
Analysts at CryptoQuant and Cointelegraph forecast a $120,000 target in the coming weeks, contingent on macro stability and sustained ETF inflows.
Institutional Adoption and Macro Drivers
The institutional landscape is reshaping Bitcoin’s market structure:
- Spot ETF Holdings: Over 1.2 million BTC ($133 billion) sit within U.S.-listed Bitcoin ETFs, representing roughly 6% of total supply.
- Major Investor Optimism: Philippe Laffont of Coatue Management projects Bitcoin’s market cap could double to $5 trillion, positioning it as a mainstream asset class alongside equities and bonds.
- Stablecoin Flows: Since early 2025, Binance has seen over $180 billion in stablecoin inflows, emblematic of traders’ confidence and fueling liquidity.
On the macro front, a tentative cease-fire in the Middle East and a 4% drop in the U.S. Dollar Index year-to-date have driven risk appetite back into Bitcoin, which is trading just 4% below its all-time high of $111,000.
Implications for Investors
For those scouting new crypto assets and yield opportunities:
- Long-Term Holding: Low exchange inflows and high outflows suggest that holding periods will likely extend, reducing immediate sell-pressure and creating a scarcity premium.
- DeFi and Layer-2 Expansion: With capital shifting off-chain, opportunities in layer-2 protocols (e.g., Lightning Network, rollups) and DeFi platforms offering staking and yield farming may see increased liquidity.
- Risk Management: Despite bullish signals, investors should monitor macroeconomic indicators—U.S. interest rate decisions, geopolitical developments—and maintain diversified portfolios.
Conclusion
The sharp drop in Bitcoin’s exchange inflows, coupled with sustained high outflows and supportive technical indicators, underscores a strategic shift from profit-taking to long-term accumulation. Institutional participation—via ETFs and large-scale investments—and favorable macro dynamics provide a robust backdrop for Bitcoin to test and potentially exceed $120,000 in the near term. For asset allocators and crypto practitioners, this environment not only amplifies Bitcoin’s role as digital gold but also catalyzes growth in DeFi and blockchain applications, paving new avenues for revenue and practical deployment.


